Walker England, of DailyFX.com, discusses the importance of understanding technical trading skills like candle patterns. Specifically, Walker discusses the bearish evening star and reviews how to use it to trade currency pair reversals.
Interpreting candle patterns is an important technical trading skill to master for any day trader. While these patterns may seem foreign at first, their recognition can confirm values of support and resistance, and even give traders confirmation of the markets direction. What is even better is that, since candles are already being displayed on your charts, with a little work you add candle analysis into any active trading strategy. With this idea in mind, today we will review the bearish evening star for trading market reversals.
What Is a Bearish Evening Star?
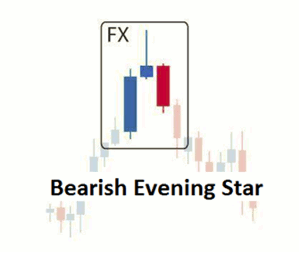
So what is a bearish evening star? A bearish evening star is a three candle reversal pattern normally found at the end of a period of bullish buying pressure. Pictured above you will see an example of the pattern, and while the primary focus is on the center candle known as the star in the center, the other two candles play an important role as well. The first candle will depict a surge in price on the underlying currency pair or CFD. The size of this first candle can vary, but it is important for this candle to close creating a new swing high.
Next, traders will look at the second candle of the pattern to identify a bearish evening star. Price should attempt to, again, breakout out to the upside here and create a slightly higher high relative to our first candle. However, any rallies seen in this position should be capped with a long candle wick with price trading back down toward the open price. Normally, a doji or inverted hammer candle will act as the star, but it is important to remember that the candle color in this position is not ultimately important. This doji or long wick from an inverted hammer suggests that bullish price momentum is concluding .The last candle should show the beginning of fresh bearish momentum. Since this is the critical reversal candle, this candle must close lower.
Learn Forex—USD/CAD with Bearish Evening Star

Created using FXCM’s Marketscope 2.0 charts
Click to
Enlarge
Uses in Trading
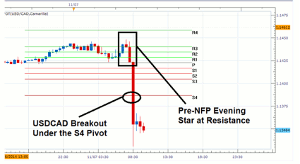
Above we can see the bearish evening star at work on the USD/CAD currency pair prior to last Friday’s NFP news announcement. First, notice how price tested resistance at the R3 pivot, but then failed to break higher. Our candle pattern helped confirm resistance, while our third candle suggests that momentum had indeed shifted downward. Knowing this, traders could have potentially taken this as a signal to sell the USD/CAD prior to Friday’s NFP announcement.
Secondarily, the bearish evening star could be used to create a directional trading bias for future positions. Traders not wishing to trade immediately, who didn’t enter the market before the news, could use the evening star to begin identifying future selling opportunities. This way, after the event itself, traders can enter the market on the side of price momentum using a variety of strategies. Above, you will find a potential breakout highlighted after the creation of the bearish evening star.
Practice with Candles
Interpreting candle patterns is like any other trading skill and will take time and practice.
By Walker England, Trading Instructor, DailyFX.com


