
Typically, price will move higher or lower in phases — attempting to trend upward or downward over time. This type of price action is normal, suggests Chris Vermeulen, chief market strategist for The Technical Traders — and a participant in the MoneyShow Canada Premier Virtual Investor Conference on Feb. 2-4.
Extended upward trends with very little downward price retracements happen sometimes — but not often. They usually happen in “excess phase” rallies or after some type of news event changes expectations for a symbol/sector.
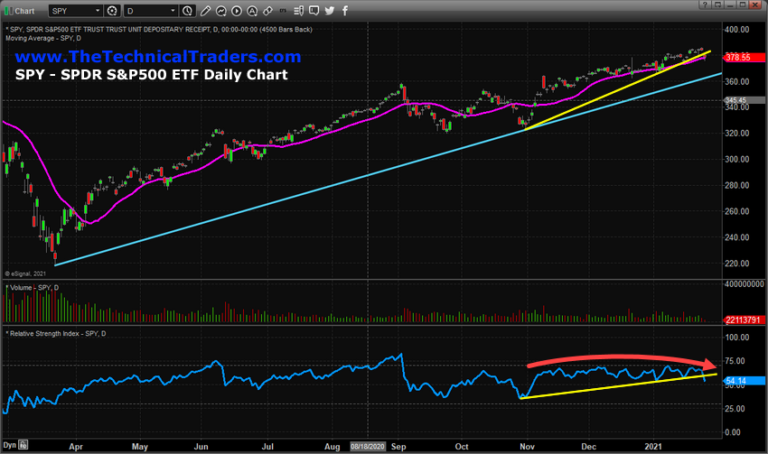
Since early November 2020, the US stock market has continued to rally in a mode that is similar to an excess phase rally — showing very little signs of moderate price rotation.
While price volatility has continued to stay higher than normal, you can see from the SPY Daily chart below that it has rallied from $324.40 to $385.95 (over 18%) in just under 90 days.
At some point in the future, a moderate price rotation/retracement will happen that may be in excess of 6% to 11% — as has happened in the past.
The purpose of this research post is to alert readers that the markets appear to have started a period of downside price rotation — which is normal.
This SPY Daily chart, above, highlights the upward support channel originating from the March 21, 2020, COVID-19 lows (CYAN line) and also the upward support channel originating from the early November 2020 lows (YELLOW line).
It is important to understand that any downside price retracement which stays above the CYAN line level should be considered a normal range price rotation within a bullish trend.

This suggests a -3% to -4% downside price trend from current levels would simply qualify as downward price rotation within a bullish trend – nothing more.
If price were to break below the CYAN upward trending support channel, then we would become more concerned that a deeper price downtrend is setting up which may target lows from Mid-November 2020 (-6.5%) or the late October 2020 lows (-13% to -14%) from current SPY price levels.
Obviously, a deeper downside trend targeting the October 2020 lows would suggest the US stock markets are potentially entering a new phase of trending – possibly a sideways consolidation trend.
The following Transportation Index daily chart shows a very clear picture of how this “rollover” in the markets has setup and where real support is likely to be found. The early January lows, near 12,180 are the most likely immediate support level on the TRAN Daily chart, below.
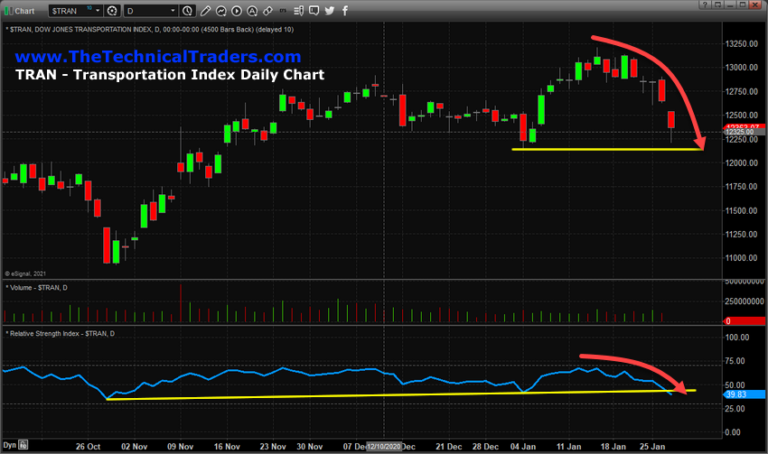
If the US stock market attempts to find immediate support to sustain the current bullish rally trend, then this level in the TRAN will likely hold up well over the next few days/weeks.
Otherwise, if the TRAN breaks below this level, then the next viable downside target become the November 2020 lows (or somewhere close to those levels).
Using Fibonacci Retracement Theory from the early November 2020 lows to recent highs, we achieve the following levels:
- 25% retracement: 12,628.92
- 38.2% retracement: 12,331.44
- 50% retracement: 12,065.47
- 61.8% retracement: 11,799.51
The 12,180 level we are suggesting will turn into critical support is just above the 50% Fibonacci Retracement level.
Therefore, any further downside trending would be predicated by a breach of both the 12,180 level and the 12,065.47 level. If price holds above either of these support levels confidently, we would consider further downside risks unlikely.
If another big market rotation were to take place in the near future, we believe early February would be the time/place for it to happen based on our predictive modeling system’s expectations.
We also believe this downside price swing will end fairly quickly and that a continued bullish price trend will resume in March or April 2021.


