
As we take inventory near the end of sell in May and go away season, we observed the stock market actually found its low at the seasonal change point in September, says Jeff Greenblatt of Lucas Wave International.
Any number of charts have been rallying since that time including Bitcoin, which found its most recent low on September 21.
Since it's back in the news again, we find it at all-time highs but has been hit the past week to the point the business media has taken notice of it. It's down a little over 13%, so they are entitled but should we use them as a contrary indicator? We have a funky reading for this high, which suggests it's likely a corrective wave as opposed to the start of a new disaster. At this point the high is up 84 weeks from the March 2020 low, which started the current leg. That means nothing by itself until such time we realize that from the high earlier this year until now its 185dg on the Gann calendar. Not the greatest reading but there is something there.
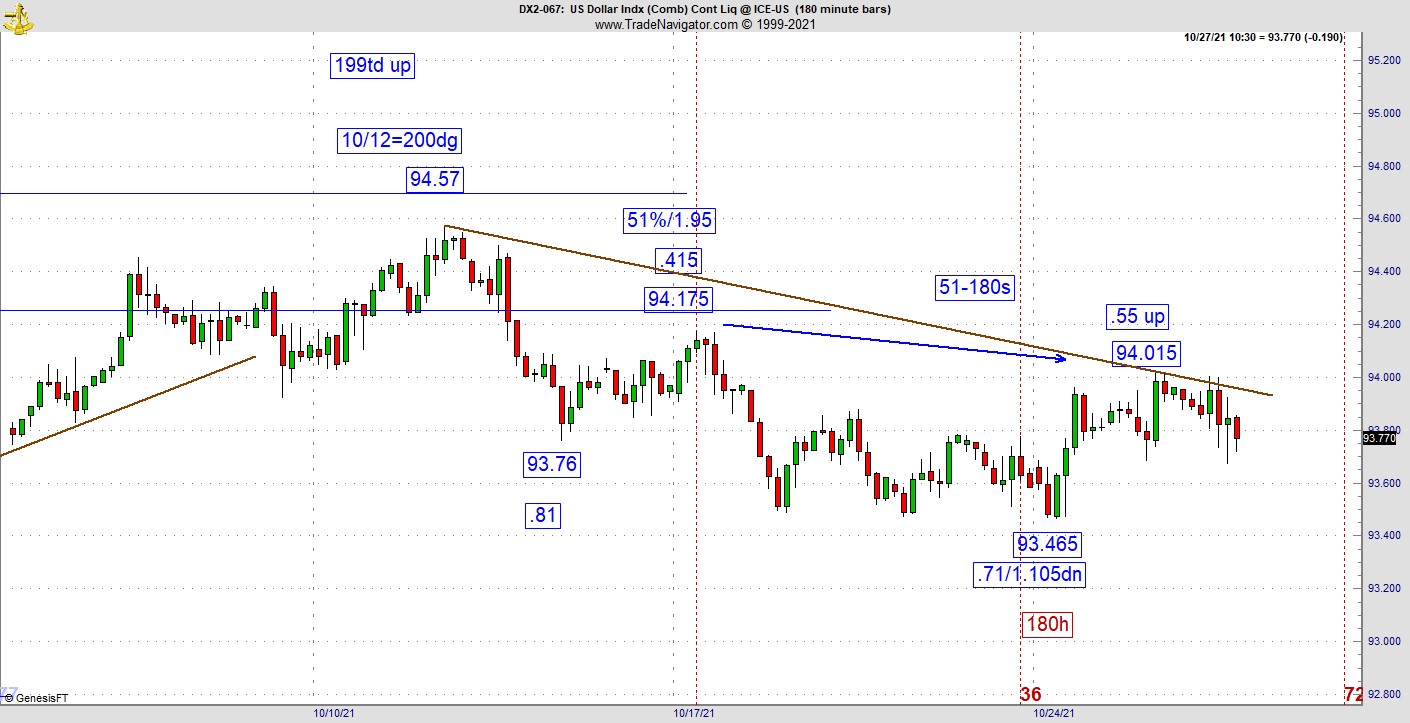
I’m writing this week with a good news, bad news scenario. Want the bad news first? The US dollar is starting to respond to its slip off the resistance ledge we’ve been talking about these past weeks and looks like it could thrust lower. We have some replication on the 180-minute chart, which the pattern has responded to but they haven’t blown the bulls out of the water. In the past month I’ve discussed a lot of things that were close to happening. Conditions, which were on the cusp and needed one more elusive distribution day, which hasn’t been coming. Same situation here for the dollar, which is likely one major distribution day away from being in very hot water again. The high came in at 199 trading days up, which was also the 200dg day on the Gann calendar for the year. That is the high right now. If someone is going to try to save the dollar, now is the time, especially with Bitcoin taking a break.
Want some potentially good economic news? We know the stock market is at or near all-time highs. We know this is possible only because the Fed has become the ultimate backstop. But there is one thing the Fed has no control over.
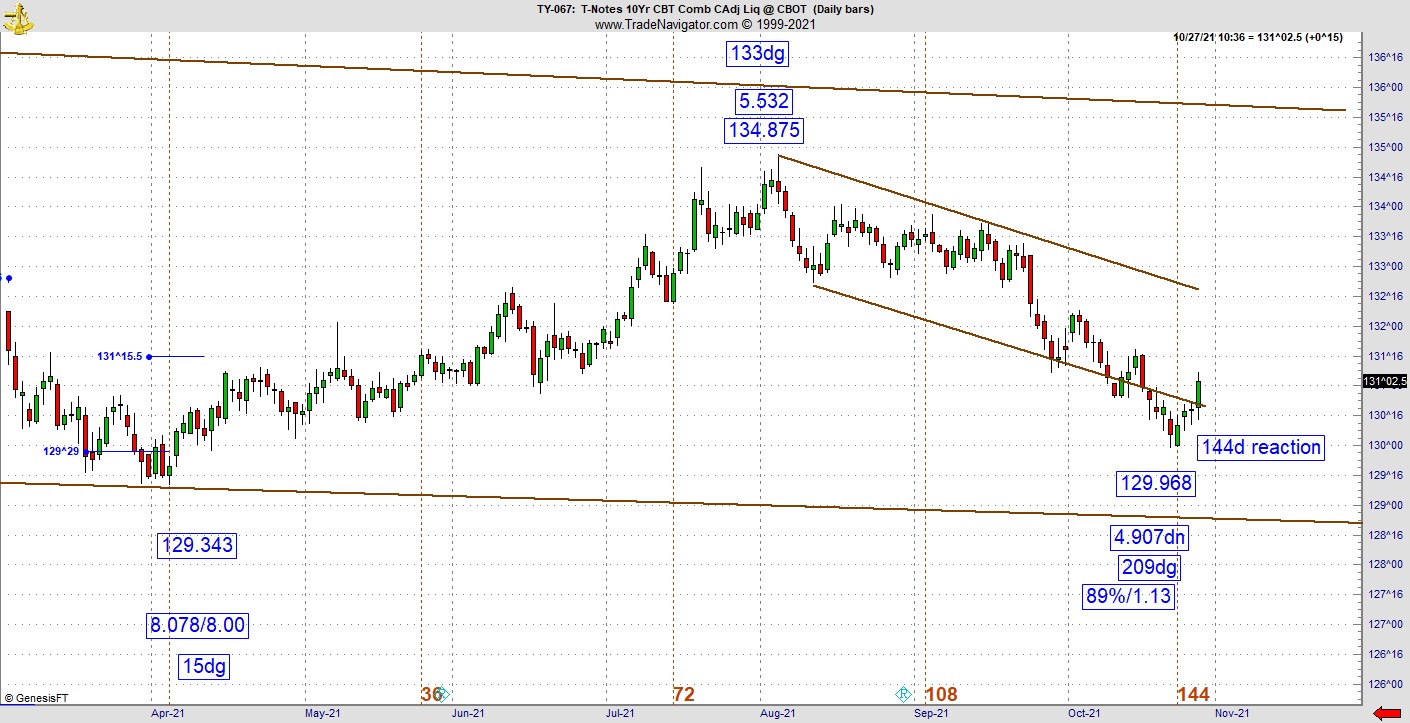
Longer-term rates. If the bond market breaks down, the stock market is going to be in a lot of trouble. Last time the bond market had a bad day the market lost hundreds of points and the bond pattern wasn’t even in much technical trouble. The daily ten-year shows the potential for some relief, even as it’s a very steep retracement of the April low. Right now, Fibonacci seems to be in control as the steep corrective wave is showing signs of changing direction because its 144 days from that prior low while at the same time its an 89% retracement. I’m not ready to say that’s a secondary bottom but a serious bounce could develop out of this setup. Is it possible the dollar could lose important value right here while longer-term interest rates stabilize yet again?
At the end of October in a year where there may very well not be any serious volatility in October, we find ourselves in a position where the market will usually correct before we hit the holiday season. That’s a month away and we may very well see news stories, which put a damper on the holiday season. Retailers need the holidays to salvage their year. What I’m trying to say I seriously doubt we can get to the holiday season without the market correcting. Risk remains high even as sectors like the BKX still looks okay even as it is now a couple of days off its high. Also consider oil has reached a point where it could start to get tired. Other than that, while we are not out of the woods, we’ve almost survived through September and October. But if for some reason the bond market doesn’t hold that 144-day window, the situation could change on a dime.
For more information about Jeff Greenblatt, visit Lucaswaveinternational.com.


