
While we have always seen a bias in advisory sentiment towards the bullish side, it has almost never been so one sided for an entire year, cautions Alan Newman, long-term market timing specialist and editor of CrossCurrents.
If ever there was a chart illustrating monumental optimism, the chart below is it. Three standard deviations is a big deal. Our normal expectation is for 99.7% of our data to occur within three standard deviations of the mean.
Sure, on any given week, we could see bullish advisors almost 3.2 times the number of bearish advisors but we are measuring a one year moving average of bulls versus bears.
Statistically speaking, this phase might be expected to occur once in a span of four or five decades. Incredibly, it has appeared three times in only seven years.
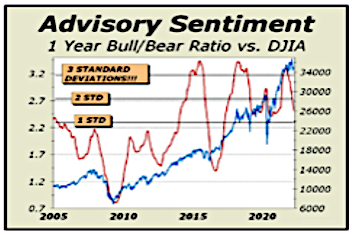
In September 2014, the one year moving average of investment advisory bulls over bears moved to three standard deviations from the norm and remained there for 49 straight weeks. It did the same in late November 2017 and remained there for 51 weeks.
Another repetition of this historic unbridled optimism occurred in May 2021 and remained similarly elevated for 17 weeks. All told, more than one-third of all our computations during this period were more than three standard deviations from the norm.
There’s simply no way to impress upon readers the level of utter lunacy achieved in this mania. This has never happened before and likely never will again. Much of the last two decades have witnessed a complete obeisance to the belief that stocks are entirely devoid of risk.
This fantastic optimism extended to repeated record levels of margin debt, likely buttressed by leverage sourced from home equity lines of credit, second mortgages, refinances and even credit card lines of credit.
In our humble estimation, what you see today is the most insane stock market mania of all time, which unfortunately, is accompanied by record levels of risk.
So, the greatest stock market mania in history continues after a very brief interruption for something the financial and news media have repeatedly and inaccurately termed “a correction.” Make no mistake, there was no “correction.” The term suggests a return to a normalized state, which is clearly not the case.
By virtually every valuation measure known, stock prices have exceeded established norms to such an extent, that the only logical expectation leads to a dire future for investors and speculators, a world in which prices are at the very least, cut in half, and remain at deeply depressed levels for years to come.
Robert Shiller’s Cyclically Adjust P/E Ratio is based on the average inflation-adjusted earnings from the previous ten years. The chart, which we have shown several times in the last year, dates back to 1870, and thus affords an excellent perspective on extremes and what to expect thereafter.
The peaks and valleys clearly delineate the largest reversals in history, from Black Tuesday in 1929 to the 1932 Great Depression low, from the 2000 Tech mania high to 2003, taking the S&P 500 down fully 50%.
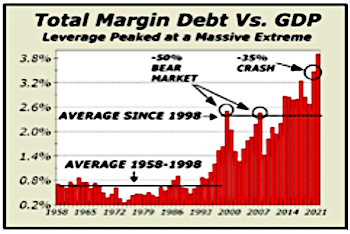
The principal reason stocks were sliced neatly in half in the previous two bear markets and by one-third in the Silent Crash of 2020 was the enormous expansion in margin debt (see chart below), which roared to new records in each of the aforementioned phases. Margin debt was not the only source of leverage, as we have already noted.
As a percentage of GDP, our highlighted examples in 2000 and 2007 were stunning, so far in excess of anything ever seen previously. No less stunning was the record the year of the Silent Crash and again last year, as margin debt peaked (pictured below) at 3.9% of GDP before finally settling at 3.8%.
How does the present situation resolve? Why would we expect anything less than similarity to either of the resolutions shown on our chart below?
It is clear that net liquidity was fueled in major part by the gigantic move of Bitcoin, exploding to just over $69,000, as mutual fund cash fell to record lows and as margin debt soared to all time record highs. It is also clear that this trinity is in the process of a monumental reversal.
Bitcoin recently traded down 45% from the peak. Mutual fund cash fell to 1.9% in December and has never been lower. Margin debt fell $80.6 billion in January, the largest monthly drop ever. The chart above is one gigantic warning signal.
In my view, it seems we’ve gone from monumental optimism, likely the most emphatic lunacy ever, to massive complacency. This does not augur well. We expect a break below our major support level at Dow 29,856 to lead to an immediate cascade down another 3000 to 4000 Dow points.


