
The market’s amazing run in the wake of the pandemic has finally hit its first speed bump this year, with the S&P 500 down around 15% and the Russell 2000 and NASDAQ down significantly more than that, explains Jack Forehand, investment strategist and editor of Validea.
Whether this decline is the start of a significant bear market or more of a blip on the radar in the overall market advance is still up for debate. But as we approach the half way mark of the year, I thought it might be a good time to look at our market valuation tool to see how valuations have changed both for stocks as a whole and in the value and growth spaces.
But before I do that, I wanted to first cover two caveats I always put in articles about market valuation. The first is that market valuation has essentially zero predictive power over short-term market returns. So the fact that the market is expensive (or cheap) tells you nothing about what it will do in the next year.
Where valuations can have some predictive power is in providing an indication of the long-term returns we can expect. Above average valuations typically lead to below average long-term future returns and vice versa.
The second caveat is that we use median figures when we look at market valuation. A median is calculated by simply ranking all stocks based on each valuation metric and then selecting the valuation that ranks right in the middle of the distribution.
Since our models select from a universe of all stocks, we like to use data that looks at the valuation of the average stock in that universe and how that changes over time. But this type of data offers no value in looking at the valuation of market cap weighted indexes like the S&P 500 or the market as a whole. For those types of indexes, the large companies are much more important to their valuation than the small ones, so median data is not useful. With that all being said, on to a look at the current valuation data.
Median Earnings-Based Valuations Look Reasonable
This is a graph of the median TTM PE of all stocks in our investable universe (market cap greater than $150 million and daily dollar volume greater than $2 million) and how it has changed over time.
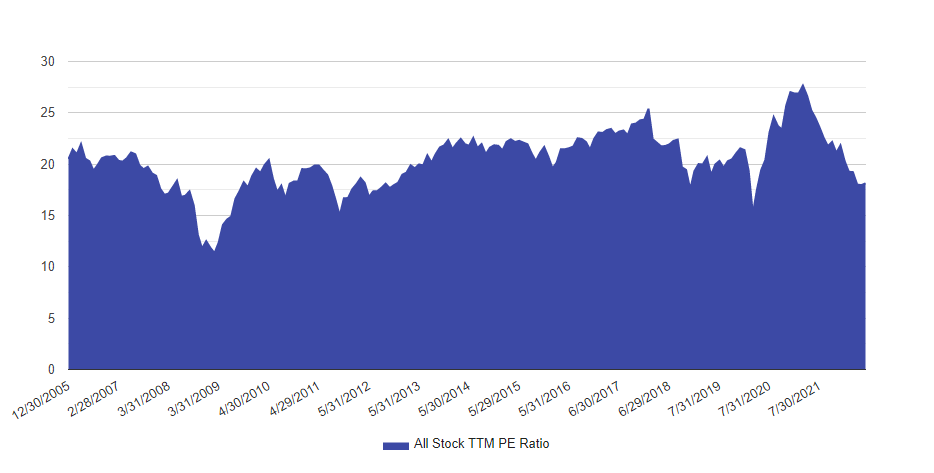
The current value of 18.1 sits in the 21st percentile for the period from 2006 to today. The average stock has declined much more than the S&P 500 this year and you can see that in the valuation data, with the median stock trading at a PE that is well below the average for the period.
One of the things that is important for all of us to keep in mind when we look at PE ratios is that they don’t offer much value if the “E” isn’t correct. And we are currently in a period where economic uncertainty is high and many believe future earnings will be less than past earnings. So let’s look at the same graph using the current year earnings estimate instead of trailing twelve month results.
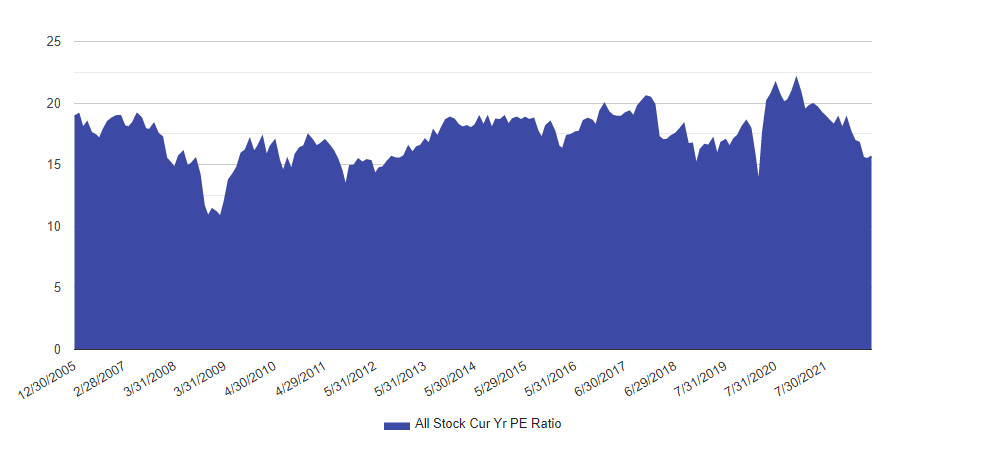
The picture is actually fairly similar, with the current PE of 16 falling in the 20th percentile historically. If earnings estimates need to come down as some predict, this number will obviously rise, but valuations look reasonable using current estimates.
Sales-Based Valuations Look a Lot Less Reasonable
But before you conclude that the average stock is cheap, it might be worth looking at valuations using the Price/Sales.
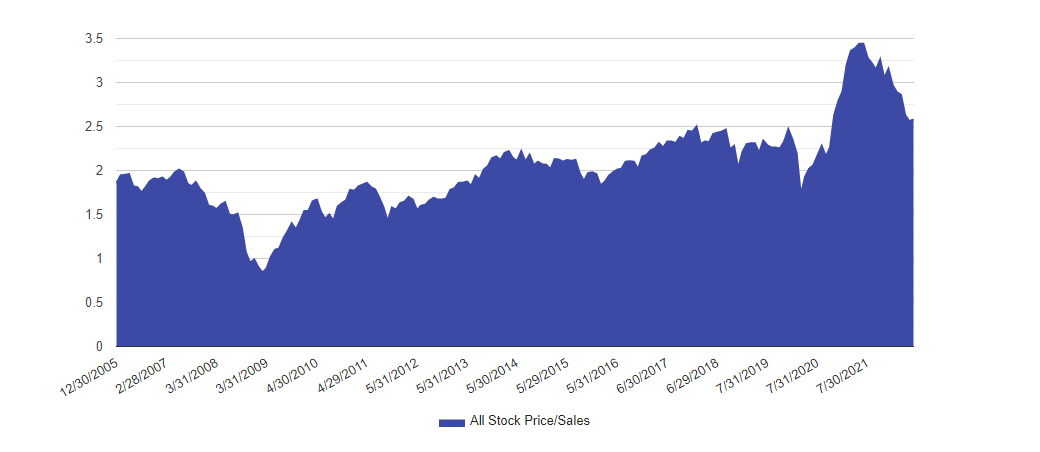
Although sales multiples have come down from their exceptionally high levels of 2021, they remain in the 90th percentile historically. The reason for that major difference is that profit margins are at historical highs due to improvements in technology, low taxes, low interest rates and other factors. Whether you expect those high record margins to continue would be the key to deciding which of these charts is most relevant going forward.
Is the Value of Value a Value?
In addition to what is going on with the overall market, there have also been some interesting things going on beneath the surface in the factor world.
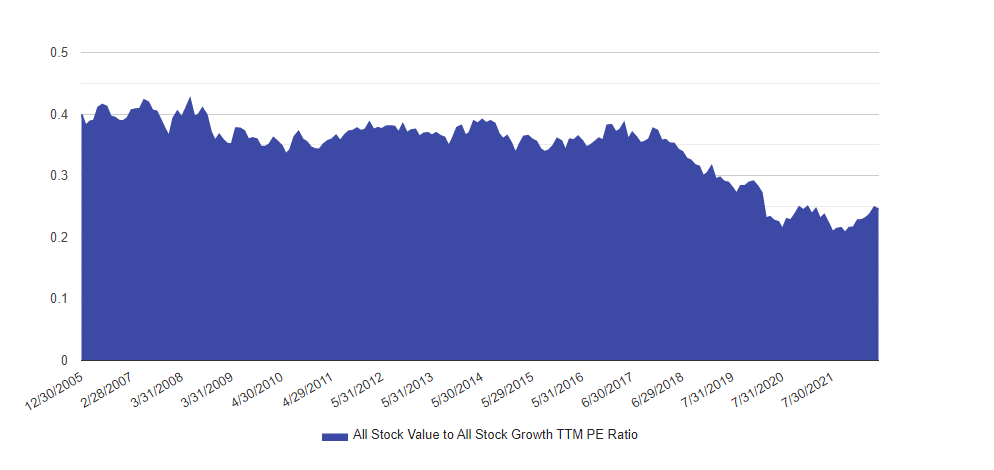
When I last wrote about value stocks, there were historically cheap on a relative basis when compared to growth stocks, but were more expensive on an absolute basis (relative to their own history).
Let’s take a look to see if the collapse of growth stocks and relative outperformance of value during this decline has changed any of that.
On an absolute basis, things have improved a lot.
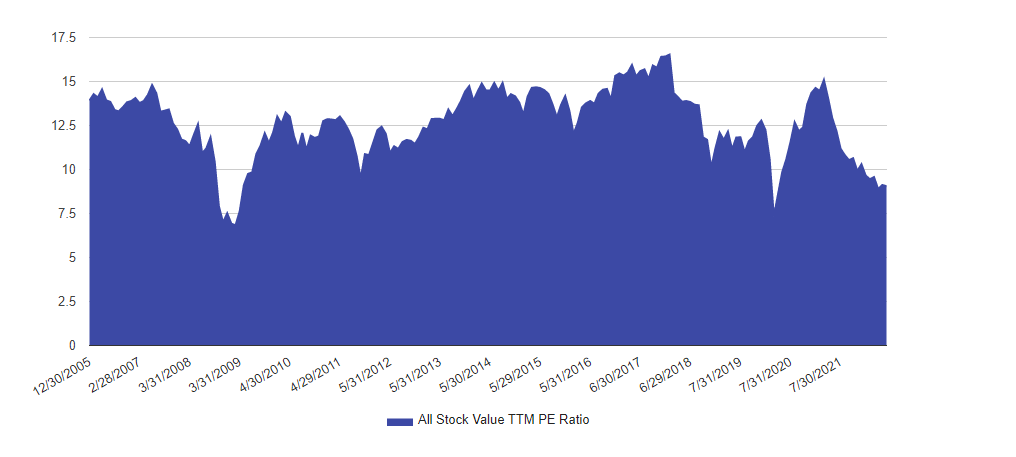
The current PE ratio of value (which we define as the median of the cheapest 20% of our database) is currently 9. It has only been cheaper near the bottom of the 2008 financial crisis and 2020 COVID crisis. So value is very cheap on an absolute basis. Relative to growth, value has become a little more expensive, but not by much.
It currently sits in the 5th percentile.
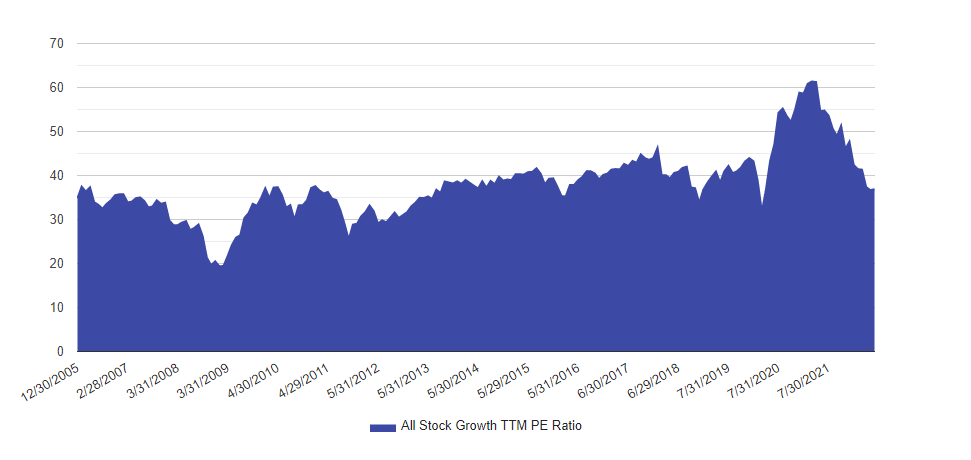
Is There Value in the Growth Carnage?
And finally, I thought it would be interesting to look at the valuation of growth stocks given their significant recent decline.
And there actually is some reason for optimism for growth investors in the data. After reaching their highest levels of the past 15 years in 2021, valuations have now fallen to middle of the road levels.
The current growth PE of 37 sits in the 47th percentile.
As I mentioned in the beginning, none of this tells us anything about what might happen in the short-term. Valuation data just isn’t useful from that perspective. But for investors who don’t invest in market cap weighted indexes, and particularly those who invest in value, long-term valuations look pretty attractive.


