
Our continuing long term call for a bear market is based on the same premise as we claimed in 1999-2000 and again in 2007-2008, warns Alan Newman, market strategist and editor of CrossCurrents.
We have been in the midst of a veritable stock market mania for over a generation, punctuated by four bear markets thus far, and currently interrupted by a countertrend rally phase. The patterns are not anywhere the same as most previous bear markets, and instead strongly suggest a bear phase of historical proportions both in price and time.
However, we need to prove our mania case. In the top chart featured below, the first evidence of a mania in progress is Dollar Trading Volume (“DTV”). Simply put, we measure total dollars spent on stock transactions each year. Over the last 23 years, there have been three huge surges in DTV. In the first instance, DTV exploded by 146% from 1998 to 2000, the greatest two year surge over the history of our chart.
The second surge was in large part fueled by automated trading systems that grew in popularity, a subject we have covered in depth in past issues. Given a boom in mortgage lending and an attendant housing boom, prices soared again to unsustainable levels and again were halved. The most recent surge in DTV took valuation measures to ridiculous extremes.
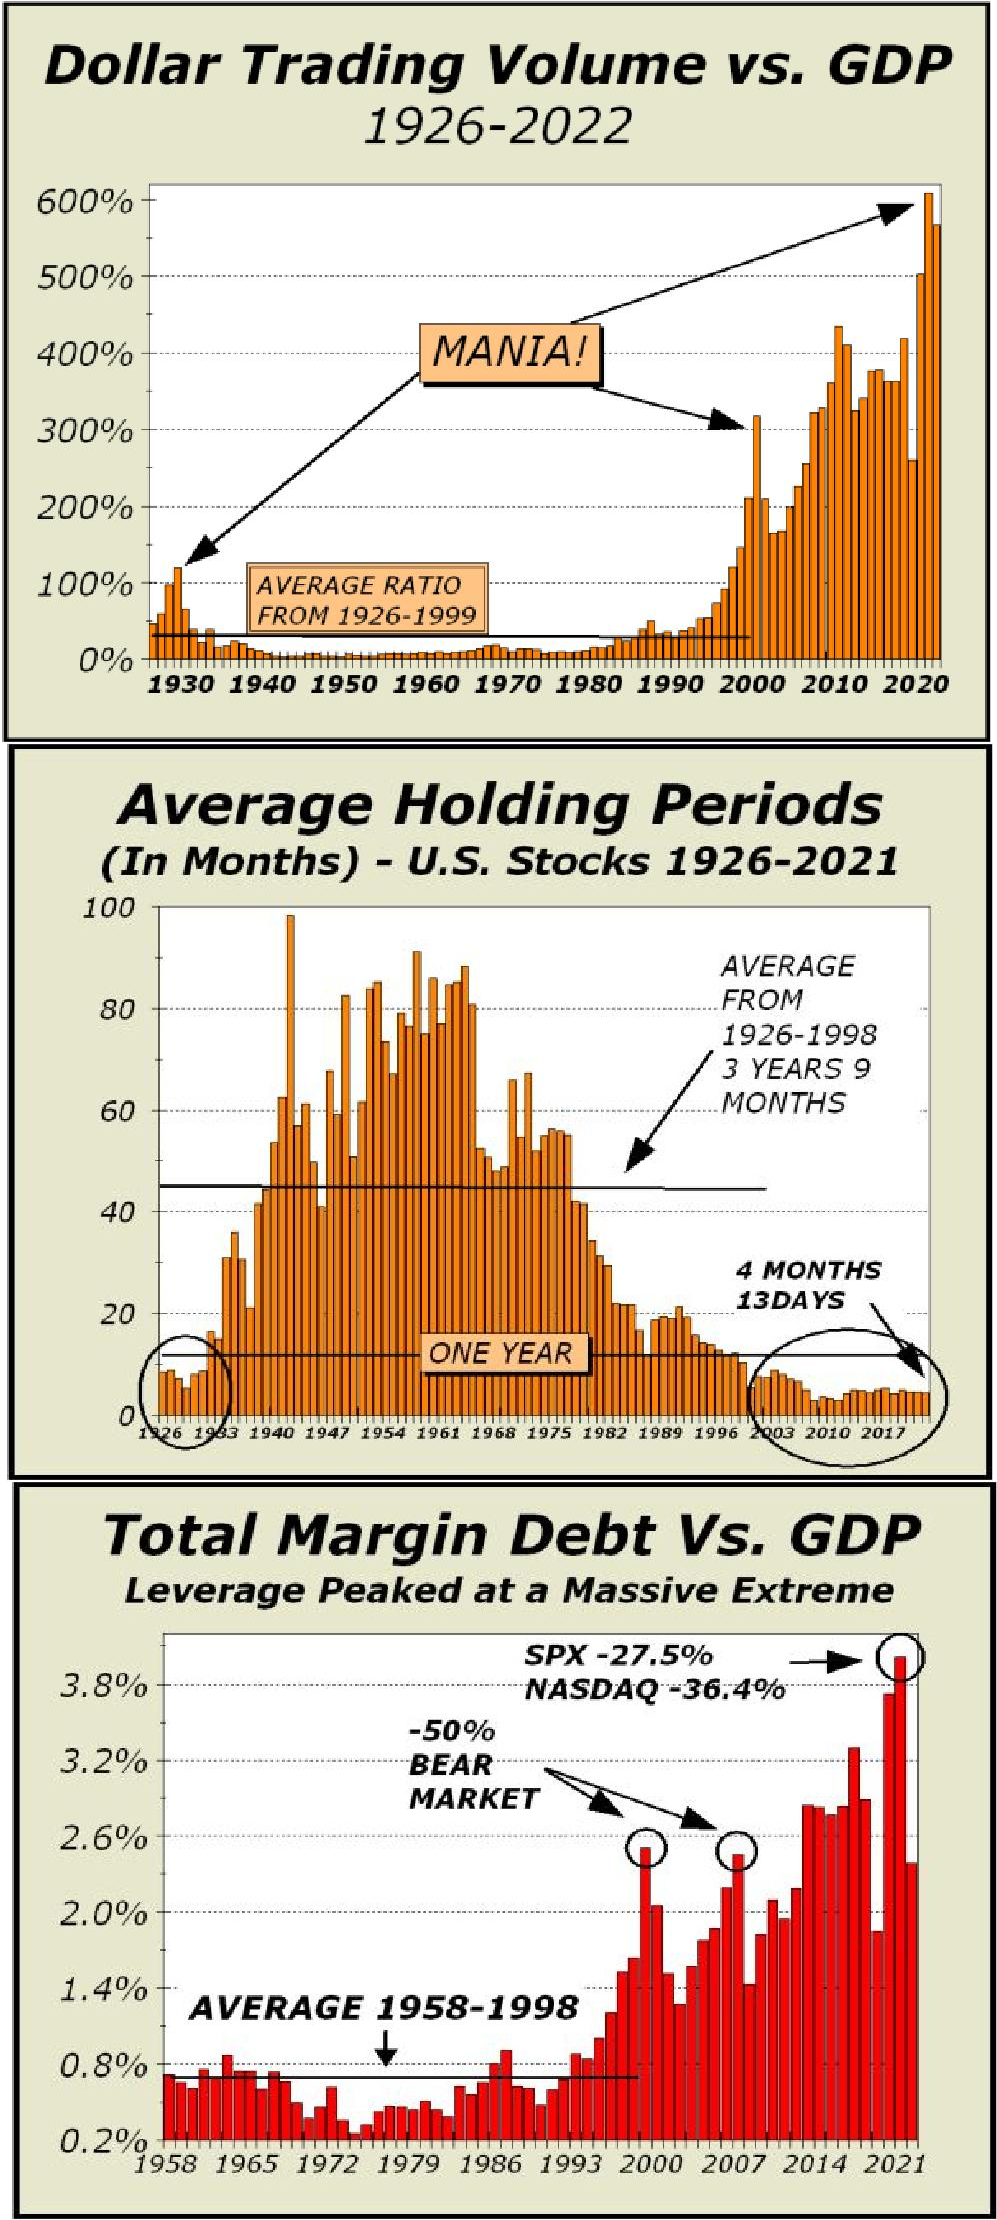
In the center chart above — as the generational long mania took hold — the average holding period for stocks fell to levels last seen in the roaring Twenties, shows more proof of a veritable mania. In 2008, holding periods dipped to under 85 days (about 60 trading sessions), far less than in the Roaring Twenties and roughly only 6% of the average holding period in the 72 year span from 1926 to 1998.
Clearly, Wall Streets advice to “buy for the long term” was a subterfuge. High frequency trading evolved to such an absurd extent that some firms were enabled to profit simply by creating dollar volume. The rapid trading earned rebates that more than covered any losses. That’s the stuff of a mania.
As prices spiked to fantastical extremes, participants were enabled to press their luck by using margin debt to buy more — as seen the the bottom chart. The utilization of margin means higher risk and greater markdowns when the bottom as it must, eventually falls out. What makes this phase of increased exposure even worse, far worse, is the implication stocks can also be purchased easily with credit card loans, mortgage loans and the like.
While the Federal Reserve limits loans to 50% of any purchase, if the 50% that buys the position is itself composed of debt, the prospect for intolerable losses zooms to very high odds. Manias end due to human frailty, when folks push their luck and wind up creating monstrous exposures to risk.
Thus, we saw prices cut in half after the 2000 and 2008 peaks and a 38% flash crash in only 24 days in March 2020. In the current bear market, damage has been relatively modest despite the enormous risk exposures shown on our bottom chart on page one. However, history strongly suggests there is far more downside to come.


