
Well, here we are again. Cryptocurrencies have been selling off and all the talking heads are pondering aloud, “What could it possibly mean?” But here’s the deal: We know the drill. We’ve been here before. And we’re going to be here again. Use pattern recognition to your advantage, explains Matthew Carr, editor of Tipping Point Profits.
In just one recent week, Bitcoin tanked more than 12.5%. That put it in the midst of its worst stretch since the FTX meltdown. Even today, the world’s largest cryptocurrency is hovering around $26,000 – well below the $31,000 levels we saw in June and July.
But predictability is a powerful tool when it comes to investing. When we know how to harness it correctly, we can leverage it to our advantage, as well as go for some stellar gains. That means we also won’t end up like 90% of the frustrated crypto traders staring bleary-eyed at their account balances.
The statistics are sobering. According to Glassnode, 88.3% of short-term Bitcoin traders – those not holding coins longer than 155 days – are underwater.
In other words, essentially 90% of crypto traders are sitting on losses, ranging from minor to double-digits or more. Or in numeric terms, roughly 2.26 million of the 2.56 million Bitcoin in the hands of short-term traders are unprofitable.
How can that be? Because they’re cryptocurrency-ing all wrong.
A lot of traders – especially Bitcoin and crypto traders – love the “Buy High, Sell Higher” strategy. It’s a surefire one that’ll lead to ruin. That’s due to the fact most practitioners get swept up in FOMO (fear of missing out) and panic selling.
But if you remember, my Bitcoin gameplan has been to accumulate at $25,000 or lower. Not to get swept up by the months of upswings. Not to chase. Then wait for our months prone for selloffs to dip our toes back in because we know what’s coming in 2024.
The greatest aspect of trend trading is recognizing selloffs and pullbacks for what they really are… Opportunities. Let’s explore the recent Bitcoin nosedive in context of what we expected and what we expect in the months ahead.
Below is the historic average monthly return for Bitcoin…
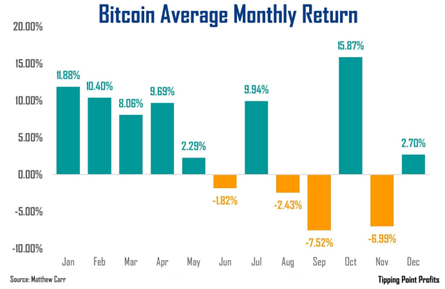
Traditionally, the most difficult months for Bitcoin have been August, September, and even November. And we just happen to be in August! Another panic that arrived right on time.
In fact, here’s a chart of Bitcoin’s returns in August since 2015…
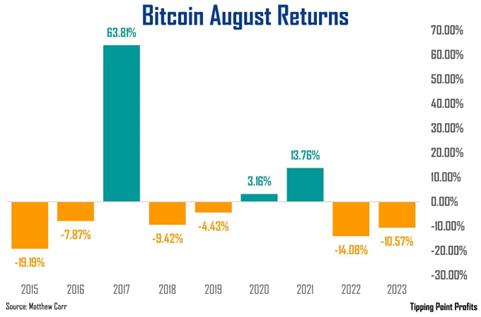
The Belle of the Cryptocurrency Ball has dipped in the month six of the last nine years.
What’s interesting to note: The years of gains were 2017 (part of the two-year reward-halving bull market), and 2020 and 2021 (two years of the reward-halving bull market). The rest, like our current August, have been downers.
But should we swoop in now? Well, if history is our guide (and it so often is here), it’s about to get a whole lot uglier. We’re fast approaching that treacherous curve known as September – a month where many a Bitcoin trader find themselves bleeding red in the proverbial ditch as the market takes a sharp turn for the worse.
Bitcoin has closed in September lower from than where it began for six consecutive years. That’s a losing streak I wouldn’t be betting against. It’s a clearly defined trend that’s taken place during both bear and bull markets for Bitcoin.
But we should be off to the races in 2024 – and that rally should stretch into 2025 thanks to the reward halving. On top of that, as we see from Bitcoin’s average monthly gain above, the first half of the year for crypto is traditionally very strong. In fact, it’s only ended the month of February with a loss once since 2015.
With these predictable patterns do you want to let opportunity pass you by?


