
Many investors are wondering if the correction in the US stock market is over. Simply put, we don’t know. It can be over if we get a lot of good news on the economy – and if there are no negative developments on the geopolitical front (a big unknown), and if long-term US interest rates drift lower from their recently-elevated levels. But that’s a lot of “ifs”, writes Ivan Martchev, investment strategist at Navellier & Associates.
From a historical perspective, September is the worst month of the year, even though in pre-election years it tends to be less bad. Since this August was negative, it is possible that September will not be as bad, or it could even be positive. We shall see.
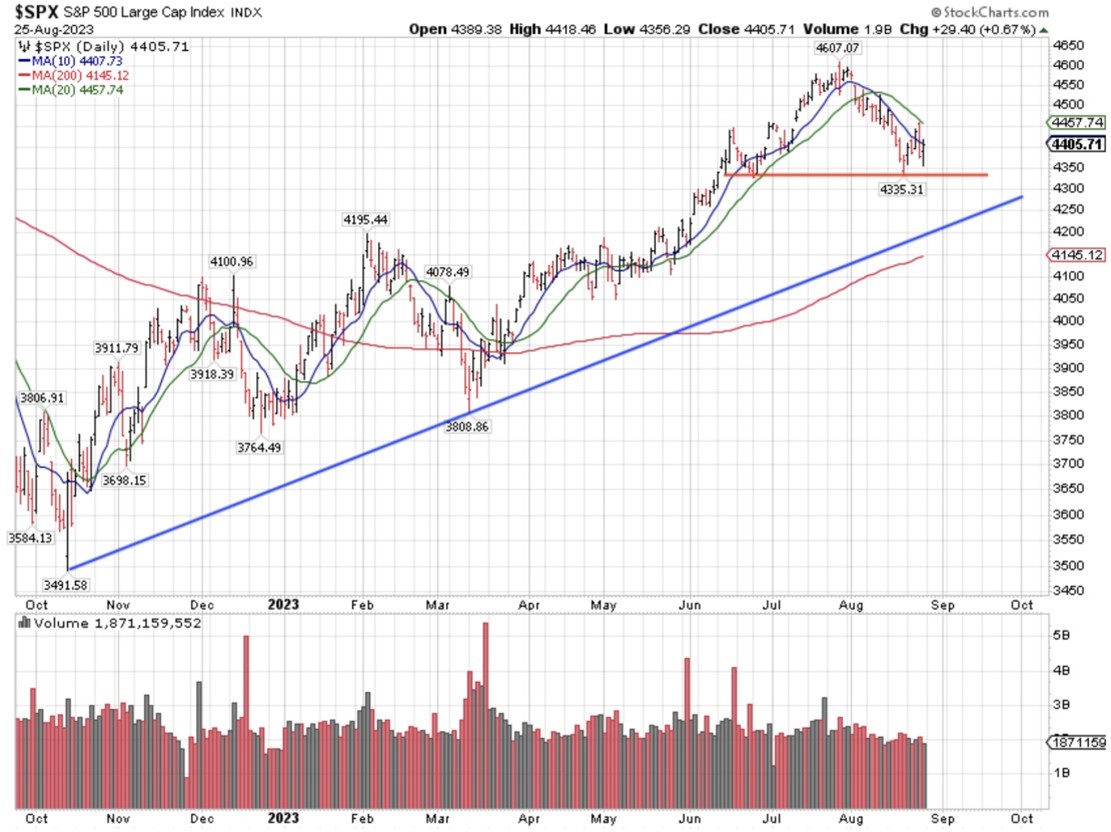
Meanwhile, some are discussing a possible head-and-shoulders top on the S&P 500. That may be a possibility, but many consolidations look like head-and-shoulders tops before they continue higher. It would only be a head-and-shoulders top if we break the red neckline and gather momentum to the downside, which we have not yet done.
Graphs are for illustrative and discussion purposes only.
There is a lot of support at the uptrend from the October lows as well as the rising 200-day moving average. A rising 200-day moving average is typically a very strong support area after the market has spent a long time above it – in this case, since March. At best, the present chart formation is inconclusive and would resemble a completed correction phase if we clear last week’s highs to the upside.
Some have suggested that the draw-down of the US Treasury account at the Fed to $44.8 billion as of June 7 may have something to do with the surging bond yields, as we have had bond issuance and corporate taxes putting the US Treasury account at the Fed to a July 26 high of $543.6 billion. That’s money leaving the financial system to get parked at the Fed before it is spent by the US government.
The more the US government spends, the more it will have to pay in interest. But there are many factors affecting long-term US interest rates, so a direct causality of the recent debt ceiling deal and surging long-term bond yields is inconclusive at best.
If we blast past 4.33% on the 10-year yield and head towards 5%, then I believe the stock market would be pressured and that head-and-shoulders top will break and most likely the index will head towards its 200-day moving average. On the other hand, if bond yields stop rising and head lower due to declining inflation data, it is possible that the correction is over.
A lot will be decided this week, but as of this writing the bias of the stock market is to the upside. As the legendary Yogi Berra so aptly put this dilemma: “When you come to a fork in the road, take it!” It sure looks like the S&P 500 will take Yogi’s advice this week.


