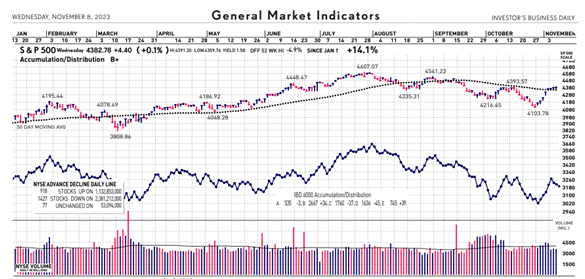
In our hectic and often hard to comprehend world, it is very easy to lose perspective. You may agree it is sometimes difficult to see the big picture. The media often doesn't help with this, but unfortunately instead encourages us to see things in a most negative light. But my indicators show the market is in a confirmed uptrend, writes John Gardner, founder and principal of Blackhawk Wealth Advisors’ Market Insights.
Analysis of the stock market over 130 years of history shows we can view it in terms of three stages - market in uptrend, uptrend under pressure, and market correction. I analogize this to a traffic signal's changing colors from green to yellow and then to red.
Since the 1880s, this perspective has led to investment out-performance relative to market indexes. This is due to trend analysis which determines risk reducing, return enhancing market entry and exit points.

In fact, US equities just posted their best weekly performance of the year as investors cheered a substantial pullback in interest rates. The S&P 500 and Nasdaq Composite Indexes jumped 5.5% and 6.5%, respectively, while the Russell 2000 soared 7.5%. All 11 S&P 500 sectors were higher, with real estate spiking 8.5% while consumer discretionary, financials, and communications all leapt 7%.
Internationally, Japan’s central bank shifted language to allow more flexibility in its yield curve control, a move that may be a precursor to an exit from ultra-loose policy. Meanwhile, the Bank of England left interest rates unchanged in a 6-3 vote but said monetary policy will likely stay tight for an extended period.
In Europe, German inflation cooled noticeably in October to 3% year-over-year, while the country’s economy shrank slightly in Q3. Similar numbers reflected across the euro zone. Finally, China’s manufacturing activity unexpectedly contracted in October as new orders shrank for the eighth straight month.
As for my other indicators, here is how they look:
- Industry Group Strength: BULLISH. As of a couple days ago, 103 out the 197 groups I monitor are up year-to-date. 94 are down.
- New Highs vs. New Lows: BEARISH. There were 79 new 52-week highs and 173 new 52-week lows recently.
- Dow Dividend Yield: BEARISH. The recent yield for the Dow Jones Industrial Average was 2.27%. The 10-year Treasury was 4.57%.
- Volatility Index: BEARISH. Volatility has been volatile. The "VIX" is now around 15. The index is also known as the "Fear Index." It is considered a contrarian indicator and therefore viewed as bullish as it rises indicating investors are becoming more fearful.
Subscribe to Blackhawk Wealth Advisors’ Market Insights here...


