
Plenty of growth stocks are feeling the pain. That’s what happens when institutional demand grinds to a halt. Don’t fret. One rare setup just fired, indicating a major ultra-bullish signal is approaching, writes Lucas Downey, co-founder of Mapsignals.com.
The rips and dips keep coming for equities. The Fed presser from Wednesday offered little confidence for investors. We’ll let other research shops recap that narrative. At MAPsignals, we’re going to focus on what we do best: Money Flows.
Our market North Star, the Big Money Index (BMI), has been in free-fall for weeks…even dropping further after Wednesday’s intraday pump and slump. But there’s good news. A monster bullish setup is forming in our data. If history is any guide, we are looking at a crowd-stunning rally coming later this year. Now is not the time to get fearful. It’s time to get cheerful.
The all-clear signal is not here yet. That’s evidenced by the Big Money Index sinking day after day. Seasonal volatility is causing overall weakness and rotational action. Inflows are seen in more cyclical areas like Energy, Financials, and Industrials as money is fleeing Big Tech.
Given Tech’s huge market weight in the S&P 500, those outflows are why major large-cap indices are anchored. Below shows how the BMI continues to spiral, last hitting a YTD low of 47.2%:
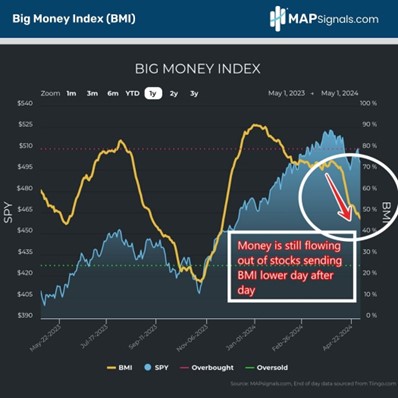
But while I’ve been pointing to overall weakness in our data since February, today’s data-driven environment is actually quite rare. Our BMI has been trending lower since December 29. That’s a long period…one that suggests a major ultra-bullish signal is approaching.
Last week we took a deep dive in our data and found something interesting. When the BMI falls 40+ points in 16 weeks, it’s extraordinary. In fact, over the past 30 years, it’s occurred 303 times.
While that may not seem exceptional on the surface, in reality most of those instances cluster around 17 discrete episodes throughout the three-decade period including back-tested data. But history proves these prolonged money flow dips are quite bullish over the medium- to long-term.
When we single out similar BMI pullbacks to now, we find six instances ranging from 1998, 2019, and 2020. What we find is stocks struggle near term, with the S&P 500 falling 4.1% a month later and 1.2% three months later. But the underlying message that you need to heed is stocks zoom six and 12 months later, with average gains of 14% and 20.3% respectively.
Here’s the bottom line: Investors are looking for clarity in this turbulent market. Data has more answers than the news ever will. We are currently witnessing a rare 40+ point drop in the Big Money Index (BMI). History says a little more pain will lead to monster gains in the coming months.


