If you missed yesterday’s article, please click here to access Part 1.
Now I ponder “For every action, there is an equal and opposite reaction.”
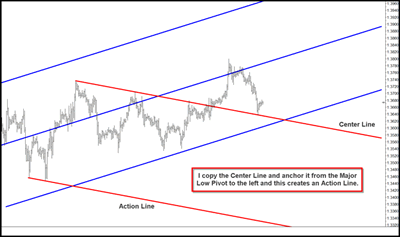
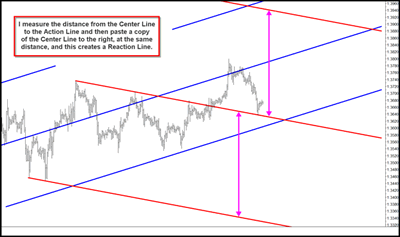
I measured the distance from the center line to the action line, and using the same distance, I create a line that has the same slope or frequency of the center line and add it below the center line. This is called the reaction line.
It can all start with one line. One thing passes into another.
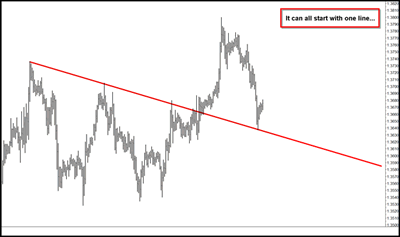
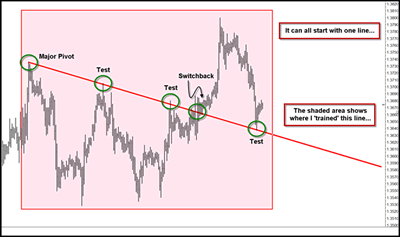
Price has been in an uptrend, but now consolidates, leaving three simple drives to the top. The three pivots, when connected, have a negative slope. But eventually, price begins its move higher again.Using the pivot on the far left, I connect the three drives to the top, and this gives me a red, down-sloping simple trend line. You can see that once price broke through this trend line to the upside, it switched back and retested this simple trend line from the upside and then began its climb higher. When it retraced, it tested the simple red trend line from above and the trend line acted as support.
It can all start with one line.
This is a down-sloping center line. You can see the pivots and switchbacks marked with green circles that I used in defining this center line. I was taught about action and reaction lines and the theory behind them from Dr. Alan Andrews. In the mid-1920s, Dr. Andrews studied the work of Roger Babson, who was a devout student of Sir Isaac Newton's Laws of Motion. Babson was particularly focused on Newton's Third Law of Motion, “For every action, there is an equal and opposite reaction.”Though Babson had his own methods of technical analysis, Andrews and a group of graduate students at MIT literally tore Babson's work apart piece by piece, and then developed the Action/Reaction Method. It all starts with one line. The one line is the center line, which projects the probable path of price.
“As above, so below.”
You should take note that I have blue, up-sloping lines and red, down-sloping lines on the same chart. Because these lines have opposite slopes, they are lines of opposing force.
I wish you good trading!
By Timothy Morgetimothymorge@marketgeometry.com
www.marketgeometry.com


