Don Pendergast of Linear Trading Systems highlights a buy signal triggered on the popular computer retailer.
Shares of Dell (DELL) can trend pretty well at times, while at other times it tends to make short, violent swings, many of which are within larger consolidation patterns.
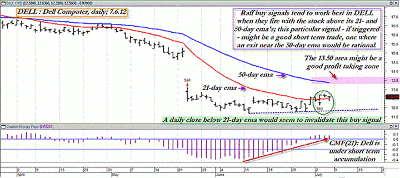
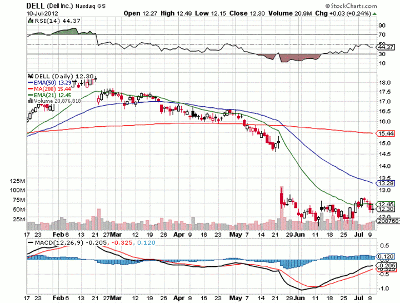
While it can be a difficult stock to trade based on a discretionary or fundamental basis, there is one trading system that appears to do a decent job of firing DELL buy signals, and usually before the stock goes into a tradable, trending move. Here’s a look at the latest system buy signal in DELL in Figures 1 and 2.
The new “Raff” buy signal (familiar to MetaStock users) will show new signs of life on a rise back above 12.73. Note the solid-looking basing pattern prior to the signal. Long-term money flow is still poor, but short-term money flow indicates minor accumulation under way.
DELL got hit hard in the May 2012 downdraft in the broad US markets. On May 1, it hit an intraday high of 16.59, and by the close of trading on June 12, the stock had finally bottomed out, hitting 11.68 on an intraday low. That’s a decline of more than 29% in less than six weeks, and for nearly a month, the stock has been attempting to build a base from which to mount a bullish reversal.
While only minor bullish headway has been made thus far, the stock has put in a very solid double-bottom pattern, and is also showing minor signs of accumulation according to the 21-day Chaikin money flow (CMF)(21) histogram.
The new Raff MarketSpace Stock system buy signal also lends some extra bullishness to the picture, especially since long buy signals in DELL with this system have a habit of embarking on sustained trend moves, particularly when the stock is already trading above its 21- and 50-day exponential moving averages (EMAs).
DELL is still below its 50-day EMA, but this signal still looks promising as a short-term profit target trade, one designed to profit from the other bullish factors already mentioned.
As a large-cap, widely followed stock, DELL is also affected by the general price cycles in the Nasdaq-100 and S&P 500. Both indexes feature bullish cycles that are anticipated to take each index above (if not higher than) their respective May 2012 highs—probably within the next three months.
This new buy signal in DELL appears to be a fairly low-risk proposition, especially for traders risking only a modest amount of trading capital—say, 1% to 2% of their account value—on any given trade.
A very simple way to play DELL here is to go long (if you haven’t already) on a rise above 12.73, running a modest three-bar trailing stop of the daily lows. Be mindful that a daily close beneath the red 21-day EMA will likely negate the entire long trade setup, especially since it’s still trading on the wrong side of its 50-day EMA.
With the SPX and Nasdaq both expected to find strong near-term support this week before turning higher once again, this could be a good time to consider a wisely sized long entry into DELL.
Just be aware that the area near 13.50 is likely going to be an area of aggressive profit taking by short-term traders—hopefully you will also be one of them, should DELL rise up to that area in the next week or two.
Don Pendergast can be found at Linear Trading Systems.


