It’s important to note current range and opening gap functions to get a sense of expectations and any adaptations that need to be made to current trading strategies, say technician Corey Rosenbloom of AfraidToTrade.com.
As we ended March and the first quarter 2013, let’s take a look at a simple reference chart of how volatility—in terms of intraday range and opening gaps—has cycled over the last few years while highlighting what the current conditions reveal about volatility.
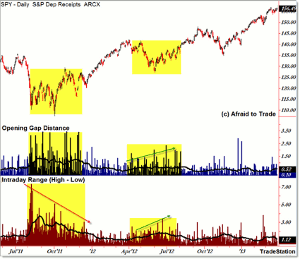
Let’s take a look first at the SPY and explain what the pure price data reveal:
Let’s first discuss how I created the indicators and what they reveal.
The blue histogram shows the “opening gap distance,” which is the absolute value of today’s open minus yesterday’s close.
There’s usually at least a small ‘gap’ or change from the prior close to the morning’s open, but it’s instructive to see large gaps, as well as a series of higher than normal gap occurrences (frequencies).
The red histogram is much easier to interpret—it’s simply the intraday range (today’s high minus today’s low), not taking into account any gap.
Volatility is cyclical and it shows up in a whole host of indicators including Bollinger Bands, average true range, but sometimes it’s helpful to look at the raw, unedited “intraday range” data.
Both histograms contain a 21-day simple moving average (roughly one month), which smoothes the raw data and allows us to view the current monthly average opening gap and range distance.
Regarding the SPY (the SP500 ETF), the current 21-day opening gap distance is 52 cents; the current average intraday range is $1.12.
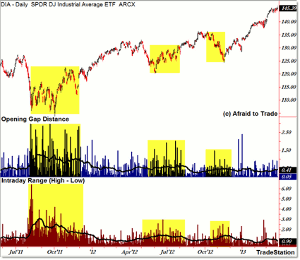
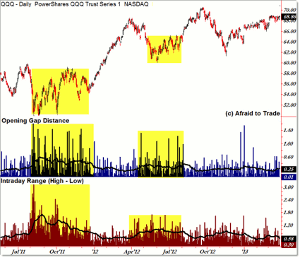
Let’s view the charts of the DIA (Dow Jones ETF) and QQQ (NASDAQ ETF) for reference:
For the DIA ETF, the current 21-day opening gap distance is 41 cents, while the average intraday range is 90 cents.
For the NASDAQ QQQ ETF, the 21-day average opening gap distance is 25 cents, while the average intraday range (high to low) is 58 cents.
It’s important to note current range and opening gap functions to get a sense of expectations and any adaptations that need to be made to current trading strategies.
Adjusting strategies and expectations can prevent disappointment during a string of low-profit days during a low-volatility market cycle period (you can’t squeeze blood from a stone).
By the same logic, adapting to a cycle of high market volatility can accomplish the following:
- Reduce ‘leaving money on the table’ (playing for typical small targets in a high-volatility environment)
- Prevent getting stopped out too frequently (using tight stops that work in a low-volatility environment that no longer work in a high-volatility environment)
- Increase targets, and thus intraday profits, (playing for bigger wins when the intraday range is high)
- Decrease account volatility (assuming one reduces position size in a high-volatility environment)
In general, a shift to a high-volatility environment from that of a low environment often calls for increased targets, wider stops, and (depending on your risk tolerance), smaller position sizes. Some very bold traders may prefer increasing position size to take account of higher volatility/intraday range.
I’ll continue to update these charts as volatility environments change over time—and history shows they will (meaning we’re currently in a low-volatility cycle that may very easily develop into a high-volatility cycle in the future).
By Corey Rosenbloom, CMT, Trader and Blogger, AfraidToTrade.com


