With the right tools and information, you can trash most of your trading checklist and focus on the two or three important factors that actually drive the markets, says Charles Cochran of Cochran Nannis Futures Trading.
You're starved for knowledge about trading. You buy all the books. You're Googling like mad through the Internet. Maybe you lay out some big bucks for a can't-miss system that works great when the market is consolidating but falls apart when it begins to trend.
After you add every technical indicator and combinations of indicators, into your trading arsenal, and put them on tick, time, volume, and range charts, you realize that all you’re getting is confused.
I’ve been there and done that. And I’m here to tell you there is a better way.
With the right tools and information feed, you will find there are really only two or three important factors actually driving the markets and that you can make good, timely decisions, if you don’t have to sort through so many variables before you take a trade.
Volume is the Key
When the market profile methodology was introduced in 1985/86, we could track price changes and the number of trades at a price. The market profile combined time, price, and volume in one display, and more importantly was based on raw data. It showed what the market was doing, not what a study said it was doing. Reality, what is actually happening is what it is all about, or what it should be about in our quest for market based information.
By using the market profile, I discovered that the one thing consistently driving the markets was the directional movement of volume, which had nothing to do with the open/high/low/close data points. Learning this, I discarded all the analysis, tracking, and manipulation on those four data points and began to focus only on volume.
However, when the market profile first came out, time and sales, or specific volume at a price were not immediately available—this data came through a day later via the CBOT’s Liquidity Data Bank (LDB). While informative and the key to the market’s direction, it wasn’t particularly helpful as it wasn’t available during market hours.
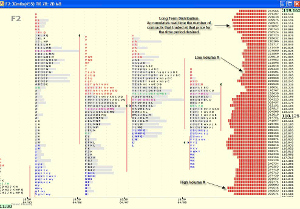
Then CQG added volume histograms to the right of the profile, and I began following the price points that had the highest number of trades. When I correlated that to the LDB the next day, the high and low volume price points in the LDB consistently stopped activity or attracted it. By combining the current day’s activity on a screen with the long-term historical data of the volume, one essentially had the same information contained in the LDB in real time.
Again, over time, I could see how the high-volume and low-volume numbers in the LDB stopped or attracted activity, and how the day’s or preceding day’s numbers in the regular market profile could be used to adjust the longer-term historical days to get within one tick of the rotational highs or lows.
What really drives the market directionally is volume. Period.
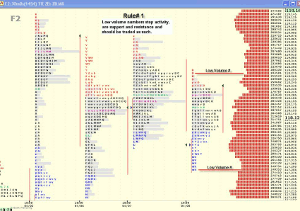
Rule #1
In commercial or hedge markets, low-volume numbers are support and resistance—they stop activity—and should be traded as such.
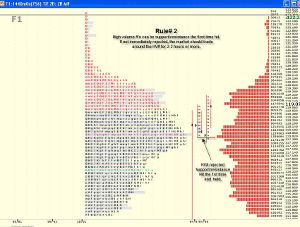
Rule #2
High-volume areas represent value and are attractors. They serve as support and resistance the first time touched only. If not immediately rejected, you can expect to trade around the high-volume numbers for one to two hours. Here’s why: It’s where new moves start. New moves come out of the middle. The way the market confirms this is through the retest—it’ll retest a breakout. If it holds, more people will come in and trade.
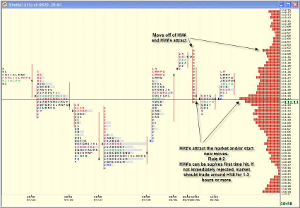
Rule #3
Don’t fade moves out of the middle (MoMs). New moves start when the market has come into balance, off the balance point, point of control, or mode. This is what a MoM looks like.
NEXT PAGE: The 3-2-1 Approach
|pagebreak|Caveat: there are MoMs and there are MoMs. MoMs can develop over two-three hours, days, or months. The longer time spent building a balance point/point of control/mode, the greater the impending move. You don’t have to be in a hurry to fade a MoM. In fact, the better trade is to jump on board and go with a MoM.
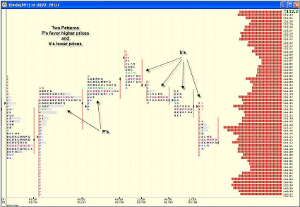
Two Patterns
When it comes to trading, there are two distinct, primary patterns that offer the most potential to trade: A capital “P” pattern indicates a retest of resistance and/or higher prices. A lower case “b” pattern shows a retest of support and/or lower prices.
Once you discover the skewing in a distribution and understand what causes this skewing, you then understand that all you really need to know is which way the distribution is skewed. This shows the market’s next directional move without news. Combine this directional knowledge with the market’s structure from the long-term distribution and you know within a tick or two where the market is going before the fact. This combination yields the most powerful trading tools available in the public or private domain.
One Indicator
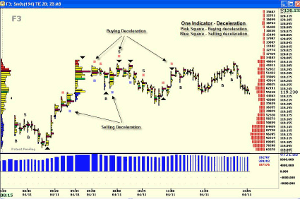
Volume deceleration is the final indicator on my 3-2-1 list for establishing good trade location.
Everyone who’s been trading for any amount of time has been steamrolled a time or two. And if you’ve ever visited the trading floor at the Chicago Board of Trade, you can see how it happens. It’s incredibly powerful: Brokers—hands in the air—indicating big buying and big selling as it is happening. And then suddenly, the brokers’ hands go down and things get quiet.
When I saw this for the first time, I realized the immediacy of it and the type of trading that could be done with visual access to actual order flow. The locals pay a tremendous amount of money to have access to this information and with good reason: They can’t be blindsided, while entering a trade. If all the brokers’ hands are down at their sides, they know nothing is going on and it is safe to trade for a bit.
The next challenge was getting this same volume deceleration information out of the electronic markets that the locals get standing on the floor. How could this be done? It was there and the basis of the auction process: As the markets move higher or lower, eventually the buying and selling interest disappears. Markets go up until the last buyer has bought and down until the last seller has sold. Deceleration in market activity and volume signals when it is time to take the trade when in proximity to the current or historical high and low volume numbers.
The pink or blue square is the equivalent of seeing brokers put their hands down at their sides. It tells you that interest in buying or selling has dried up at this level and it means the market will do one of two things: It will pause and continue moving in its current direction after a rest or after pausing, or retrace its recent move by trading in the opposite direction. This helps you avoid those situations where you could get steamrolled.
Conclusion
Three rules. Two patterns. One indicator. All based on the market profile and keenly focused on volume movement in conjunction with the long-term distribution. The 3-2-1 approach eliminates much of the noise and most of the variables currently used in your approach to trading. You can make better trading decisions, and more quickly too. With the right tools and information, you can trash most of your trading checklist and focus on the two or three important factors that actually drive the markets. This can only improve your decision-making and your trading performance.
By Charles Cochran, Co-Founder & Managing Partner, Cochran Nannis Futures Trading

