
In this article, Jared Wesley of Pristine Capital Holdings, Inc. offers a potpourri of tips and ideas for swing and position traders.
The futures are showing a slightly more bullish picture than the index below, but it is not likely this area will hold. Don't act on it, as we are waiting to be bullish on the daily charts in the appropriate area. The failure of these green bars to hold, if they do fail, will bring about selling that will come close to the area we will set as a low. You can see this area on the weekly chart.
Naturally, these are observations at the moment. Things can change if we gain more information. We have time to gather that information, as this is currently 'sit on hands' time as a swing and core trader and wait for the moment to be bullish again.
Hot Sectors
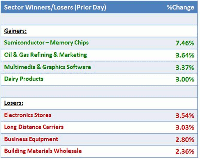
Click to Enlarge
Trading Ideas
The following ideas are named as either a swing play (expected to hold approximately two-five days); or as a core play (expected to hold for weeks), or as just an idea. Even though ideas are the best plays out there on that particular day, they will not be tracked in the current plays' section as they do not meet all of our criteria, or the market timing was not correct.
Click to Enlarge
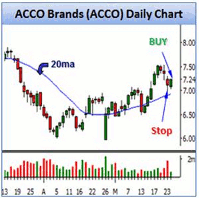
ACCO: Industry: Office Supplies. Chart Set-up: Daily Pristine Buy Set-Up (PBS). ACCO has pulled back to an area of mS just above the r20ma with a bullish COG bar in a transition phase A on the daily chart after a weekly double bottom.
Click to Enlarge
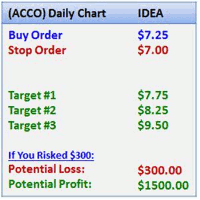
ACCO: Industry: Office Supplies. Chart Set-up: Daily Pristine Buy Set-Up (PBS). We'll look to buy ACCO as an idea only if it trades above $7.25 with a protective stop loss below $7.00. Target #1: $7.75. Target #2: $8.25. Target #3: $9.50. Trading Tip: Multiple timeframe analysis is an important part of successful trading.
Click to Enlarge
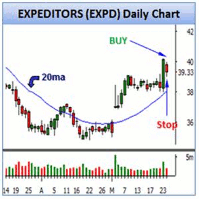
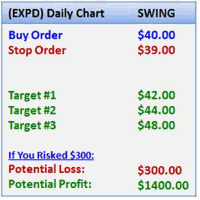
EXPD: Industry: Air Delivery & Freight Services. Chart Set-up: Daily Pristine 123 continuation play (+123). EXPD had a wide range igniting bar on volume over a daily consolidation moving into the void above followed by a narrow range resting bar.
Click to Enlarge
EXPD: Industry: Air Delivery & Freight Services. Chart Set-up: Daily Pristine 123 continuation play (+123). We'll look to buy EXPD as a swing trade if it trades above $40.00 with a protective stop loss below $39.00. Target #1: $42.00. Target #2: $44.00. Target #3: $48.00. Trading Tip: Novice volume usually ends a move and pro volume usually ignites a new move.
NEXT PAGE: How “Sharpe” Is Your Batting Average?
|pagebreak|How “Sharpe” Is Your Batting Average?
In many professions, and especially in the world of sports, we often talk about averages and percentages as a tool for measurement and success. Generally speaking, the higher the average or percentage, the better the result. In car sales, people want a high “closing” percentage, in baseball, players strive for high batting averages, in golf it's fairways and greens in regulation. Well, in trading it's no different. Many traders have been taught to strive for high batting averages as a measure of success. However, this can be very misleading, because a high batting average alone does not necessarily equate to a profitable trader. A trader with a batting average of 40% can sometimes be vastly more profitable than a trader with a batting average of 70%. How so?
Certainly it would be nice to have a 100% batting average, but this is not realistic, no matter how experienced you are. Though we know that perfection is unrealistic, this would assume that 70% isn't too bad, and certainly better than a 40% BA. So how is it that a trader with a 40% BA can possibly make more than someone with a 70% BA? It's called Sharpe ratio.
What is a Sharpe ratio (win/loss ratio)? Simply put, a Sharpe ratio is our average winning trade (in dollars) divided by our average losing trade (in dollars). For example, if our average winning trade is $100, and our average losing trade is $50, our Sharpe Ratio would be 2.0. If our average winner is $75, and our average loser is $85, then our Sharpe ratio would be .88. So why should your Sharpe ratio concern you? Let me explain.
Let's take two traders (we'll call them Bob and Mary) over the course of 20 trades. Bob has a batting average of 75% and Mary has a batting average of 50%. Both traders are risking $100 on every trade.
Out of 20 trades, Bob wins 15 and loses five. But, on his winning trades he only averages $75 per win, and he also averages $75 per loser. This means that Bob's 15 winning trades will make him $1125, and his five losing trades will lose him $375. Therefore, after his 20 trades are complete, Bob will make $750 ($1125-$375 = $750. Bob's Sharpe ratio is 1.0 ($75/$75 = 1).
What about Mary? Out of 20 trades, Mary wins 10 and loses 10. On her winning trades she averages $250 and $100 on her losers. This means that Mary's 10 winning trades will make her $2500, and her 10 losing trades will cost her $1000. Therefore, after her 20 trades are complete, Mary will make $1500 ($2500-$1000 = $1500). Mary's Sharpe Ratio is 2.5 ($250/$100 = 2).
So, despite having a batting average 25 points lower than Bob, Mary made double what Bob made. What does this tell us? Simply put, that batting average alone does not make a trader great! The positive aspect about the two traders in the example above is that they are both profitable. This is not always the case. Many newer traders with high batting averages get out of their trades too soon for various reasons (usually fear). They simply don't allow their trades to materialize. So their high BA often doesn't produce profits. After all, batting average is not very important if you are not making money.
NEXT PAGE: Measuring Your Trading Success
|pagebreak|On the other hand, many novice traders commit the ultimate sin. They not only have lower batting averages, but they also have low Sharpe ratios. They allow their losers to fully stop them out, yet cut their winners short. This is a very bad combination, often brought on by a lack of confidence in their trading ability.
Remember that by letting your trades run, you may lose a few more, but the ones that win will also be much larger, thus producing a higher Sharpe ratio. Naturally the ultimate goal is to have a high batting average and a high Sharpe ratio. This will make a handsome income, but is also very difficult to achieve. Just keep in mind, everything is a balance. Typically a higher Sharpe ratio allows for more flexibility when it comes to batting average. So if you only have a 1.0 or 1.5 Sharpe ratio; naturally you will need a higher BA to make a reasonable profit. It's a bit like a sliding scale. Lower BA, you need a higher Sharpe; a higher BA and you can “get away with” a lower Sharpe. If you can find an acceptable balance between them, you will be on track to make a handsome income! As a general guideline, swing and day traders should shoot for a 45-55% BA with around a 2.0 Sharpe. For scalp traders, a 55-70% BA and a 1.5 Sharpe is acceptable.
The last point that needs to be discussed is making sure your average winning trade is at least the same amount as your risk level. If you are risking $100 per trade, then your average winner should be at least $100. In the above example, if Bob's average winning trade goes from $75 to $100, his profits increase from $750 to $1125, which is a significant difference. This would also increase his Sharpe ratio as well. So, the moral of the story is, as long as your average winning trade is at least the same as your risk level, then having a “reasonable” BA and Sharpe ratio is surefire way to becoming a successful trader.
As shown above, two traders entering the exact same trades can often have very different results. Batting average alone does not guarantee success. Sharpe ratio alone does not guarantee success. But together, they can be a powerful combination! The trade management section in your trading plan will help determine this. Though both batting average and Sharpe ratio will have an impact on your profit margin, more often than not, the Sharpe ratio will be the difference between a successful trader and a not-so-successful trader! So the next time you are trying to improve your profits; have a look at your Sharpe ratio to see if you are getting the most from your trades!
By Jared Wesley, Moderator, Pristine Method Trading Room, Pristine Capital Holdings, Inc.


