
When an intermarket relationship breaks down, it usually does so temporarily, so traders should pay attention, so they don't get caught when it returns to normal, notes technician Corey Rosenbloom of AfraidToTrade.com.
If you closely follow the day-to-day activities on the intermarket landscape, you probably saw crude oil diverge relative to the new highs in the SP500.
If not, let's take a look at the close connection that's been strained temporarily with respect to price action over the last few sessions.
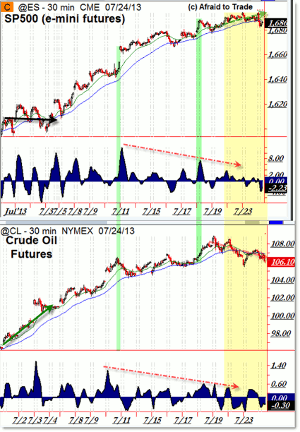
Here's the broader intraday picture:
Click to Enlarge
The top chart shows the @ES SP500 e-mini futures on the 30-minute chart with relation to crude oil futures (@CL) on the bottom panel with the 3/10 MACD momentum oscillator to highlight an ongoing divergence in the correlated markets.
The main idea is that these markets have traded together throughout the recent pro-trend rally phase, yet oil does not trade at all-time highs while the SP500 did break out to new highs.
The green highlights represent strength or impulse in price that was confirmed in both markets to continue the creeping uptrend to present.
However, we not only have a momentum divergence undercutting the rally, but we also have a cross-market divergence as crude oil failed to confirm the recent new swing highs in the SP500.
In fact, crude oil began trading lower on July 19's relative peak and was down for the full session where the SP500 experienced a bullish trend day up.
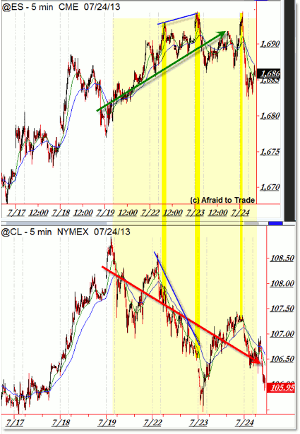
Here's a detailed view of the recent course-correction in the markets:
Click to Enlarge
I'm emphasizing the dislocation in price between the markets by showing not just the intraday trend (green or red arrow), but also the comparison of new price highs achieved in the SP500 that were actually visually lower highs in crude oil.
This is something worthy of attention as the short-term strong correlation between these markets temporarily bends.
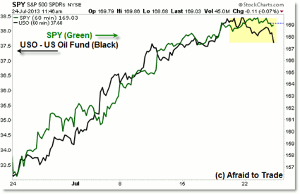
I wanted also to show the related ETFs (exchange traded funds) on a broader perspective in respect to the trend and recent divergence.
The chart below is the SP 500 ETF (SPY) and US Oil Fund (USO), which can be used as proxies to trade or hedge positions in these markets:
Click to Enlarge
Similarly, the SPY (green) and USO (black) traded closely together all the way up to the recent highlighted region where USO weakened relative to the continued strength of the SPY.
If you are new to the intermarket or cross-market perspective, it will be interesting to watch how far the correlation bends and what it may say about the state of the overextended rally.
At a minimum, it suggests strong caution to the bullish side unless we see a sudden up-tick in crude oil to catch back up with stocks, and it may even forecast early money flow into defensive or profit-taking positions (short-term reversal lower in both markets).
Monitor these markets not only with respect to their chart resistance/support (trendlines and moving averages) targets, but also relative to each other.
By Corey Rosenbloom, CMT, Trader and Blogger, AfraidToTrade.com


