
As a trader, it is important to have a good understanding of the basic patterns before trying to develop a strategy that offers a potential edge, so Phillip Streible of RJO Futures outlines two of them, citing examples of each in the Crude Oil chart.
There are many different types of fundamental and technical chart patterns market technicians focus on when making trading decisions and multiple ways to interpret them. This is why technical analysis is an art form. The key is to be able to recognize these patterns and implement a trading strategy based on what you believe the charts are telling you are going to happen next. As a trader, it is important that you have a good understanding of the basic patterns before you can develop a strategy to give you a potential edge. When you combine a couple of these different methods, you really unlock the power of technical analysis.
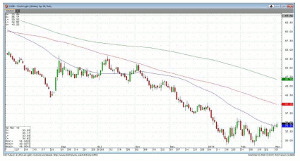
Moving Average Crossover
A moving average is the average value of a market’s price over a defined time period and can mark important support and resistance levels in the market. The basic concept is to be long when the market is trading above the moving average and short when below. The most common moving averages are the 50-, 100-, and 200-day, although traders use other numbers. You can use whatever you are comfortable with to gain a unique edge. The moving average crossover is a trend identification tool that compares different moving averages. It provides a trading signal when momentum shifts directions. When a shorter moving average crosses a longer one, the trend is seen as up. When a shorter moving average crosses below a longer one, the trend is seen as down.
Moving averages do give a delayed signal, because they are computed using historical data. Using end-of-day data is more useful for some traders, because there can be an intra-day crossover that could give a less reliable signal.
In the Crude Oil chart, we did see the blue 50-day moving average cross the red 100-day recently as the market broke down and it seems as if the green 200-day moving average would show that Crude Oil is in a significant bear trend. If the market trades under the 100-day for a few sessions, that reinforces a bearish shift we were seeing with our other indicators.
Click to Enlarge
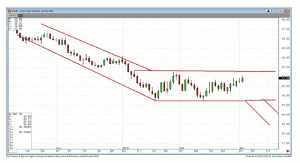
Trading Range Breakout
A trading range breakout is a breakout out of a congestion zone that contained price fluctuations for some time. I’m showing daily chart patterns that illustrate longer-term trends, but you can shorten the time horizon to a 60-minute, 15-minute, or even a 5-minute chart for very active, short-term trading strategies.
The types of breakouts you might see visible in chart patterns include pennants, flags, and triangles. The basic strategy is to buy or sell a two-day breakout to one side with a stop on the other side. (For a shorter-term strategy, focus on two bars instead of days).
We can see an interesting breakout pattern developing this spring. In the Crude Oil futures, we see the pennant start to narrow (it looked like do or die for the market). This type of pattern tends to move in the direction it had gone before.
We also see a flag formation to the far right of the screen. We have the pole coming down, a flag going sideways, and generally what happens is that the market will continue moving in the direction prior to the flag (the pole). The general rule is to look for a move of 50% of the pole. That would bring the market back to 50% Fibonacci retracement level.
Click to Enlarge
To read the entire article, click here…
By Phillip Streible, Senior Market Strategist, RJO Futures


