Stocks are clearly in a sustainable rally, as the charts show, but the watchword for new investments is patience, writes MoneyShow.com senior editor Tom Aspray.
As we get ready for Halloween, there is once again a group of market followers who are getting tricked, not treated, this year.
After a record-breaking week in the stock market and one of the best October performances since 1974, talk of a double-dip recession has again subsided. This is all too familiar: just over a year ago, in the summer of 2010, the fears of a double-dip recession also dominated the financial press, frightening investors out of the stock market.
For example, an article from CNBC titled “Economy Caught in Depression, Not Recession” appeared on August 24, 2010. Economist David Rosenberg from Gluskin Sheff expressed his view that the economy was really in a depression and advised that it was not too late to get out of the stock market.
He had lots of company from other economists, and by late August 2010, the financial newsletter writers were also extremely bearish on the stock market. TV traders were competing to be more bearish than their fellow traders.
This is very similar to what we have experienced in the past few months, as very bearish headlines dominated the press. Pessimism over stocks and the economy reached a fever pitch by the middle of September.
The majority seemed to preparing for another financial collapse. Major brokerage firms were racing each other to cut their forecasts for the S&P 500 and the economy, while investors bought treasury instruments with no yield.

Now, just over a month later, some are already starting to change their tune. Thursday’s better-than-expected GDP numbers, along with other recent economic data, have convinced them a double dip is now less likely.
In fact, as this Wall Street Journal chart indicates, the consensus estimate for GDP going into 2012 are for higher growth than we have seen in the past two quarters.
Don’t get me wrong: I don’t have a lot of faith in these estimates either, and that is why I look at the markets from a technical perspective. In September 2010, the technical readings also turned bullish, as they did several weeks ago.
As I discuss more in the What to Watch section, I think there will be further good opportunities to get back into the stock market…but patience will be the key.
It was, of course, the widely watched Euro summit last week that was given the credit for the dramatic gains, though stocks were acting quite well before the announcement. Will the Euro package really work? Personally, I have no idea, and would have to give it a 60% chance that it won’t…for now, at least.
I do expect that we have entered a period where the Euro crisis will not dominate the market as it has for the past few months. Bad news about a Greek default, or even the renewed threat of one, is likely to cause a sharp market decline that will probably turn out to be a good buying opportunity. The Euro has strengthened and looks ready to frustrate those calling for an imminent Euro collapse.
This week there is quite a bit of economic news, culminating on Friday with the monthly employment report. Certainly I would expect some fairly negative economic numbers over the next few months that could rattle the market, providing some buying opportunities.
On Monday, we have the Chicago Purchasing Managers report and the Dallas Fed survey, followed on Tuesday by the widely watched ISM Manufacturing Index.
It only gets better from there, with more significant information coming in from the ADP Employment Report, the FOMC Meeting Announcement, and Ben Bernanke’s press conference on Wednesday
Thursday brings the weekly jobless claims, factory orders, and the ISM Non-Manufacturing Survey.
NEXT: What to Watch
|pagebreak|WHAT TO WATCH
Last week’s 3.8% surge in the S&P 500 and 3.7% gain in the Dow Industrials was even more than I expected. The bulls started to stampede, not just charge.
This has put underinvested portfolio managers in a tough spot, as we near the end of the month and their lack of equity exposure should be a positive factor going forward.
The sentiment picture has started to change. Market technician and option expert Larry McMillan points out that his analysis of newsletter sentiment turned positive this month, just as it did in the late summer of 2010.
To Larry, 2011 closely follows the pattern of 1998, when stocks rose more than 35% from the October lows through early January of 1999. This sort of rally would not surprise me either…but I will take it one step at a time.
Over the next week or so, I would look for either a decent pullback of 2% to 4% or, alternatively, several days of choppy action where the S&P 500 may trade in a 10- to 20-point range. In either case, this should set the stage for another sharp move to the upside.
Both gold and the bond market will bear close watching this week as there are signs that the bond market may have topped out. If it has a further rise in yields, it is likely to trigger a shift by some from bonds to stocks.
Gold is holding up better than expected, making it possible that the correction from the September highs is over, but I am not totally convinced yet. Traders are also making a bullish bet on the emerging markets, and those have likely bottomed out.
S&P 500
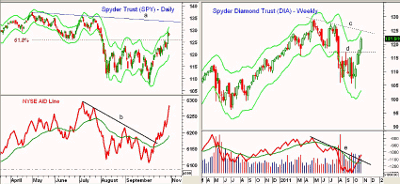
As I noted last week, the ability of the Spyder Trust (SPY) to hold above support at $119 for eight days—as well as the strong weekly close—suggested upward acceleration.
The 61.8% Fibonacci retracement resistance level at $125.82 was decisively overcome, with psychological resistance at $130 and the upper daily Starc+ band at $131.20.
The major trend line resistance on the daily chart (line a) is at $133.60, with additional major targets at $134.82 and $135.70, which were the summer highs.
The NYSE A/D line has turned up more sharply this week after breaking its downtrend (line b). It is well above its WMA, so it’s a bit overextended.
There is first good support at $124 to $125, and then at $122.60.
Dow Industrials
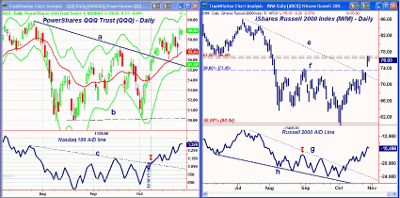
The Spyder Diamonds Trust (DIA) closed above the 61.8% retracement resistance level at $119.16, signaling Thursday’s move to the $122 area.
The downtrend from the 2011 highs (line c) and the weekly Starc+ band are now in the $124.70 to $126 area.
The weekly on-balance volume (OBV) has broken its downtrend (line e), and has moved above its WMA. The daily OBV (not shown) has been in an uptrend from the August lows, and formed a positive divergence at the October lows.
There is first support now at $118.50 to $119, with stronger levels (line d) in the $117 area. The Dow Industrials A/D continues to act stronger than DIA.
NEXT: More Stocks, Sector Focus, and Tom’s Outlook
|pagebreak|Nasdaq-100
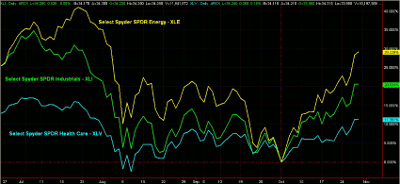
The PowerShares QQQ Trust (QQQ), after holding above the 38.2% retracement support at $55.16, has surged back to resistance at $59. The Starc+ band is at $60.30 with trend line resistance in the $61 area.
The rally has not been as sharp as it has been in some of the other averages. There is initial support now at $58, with the former downtrend (line a) in the $55.60 area.
The Nasdaq-100 A/D broke out to the upside on October 10 as it overcame its downtrend (line c). It has formed higher highs, but appears to be losing some upside momentum. It does not look as strong as some of the other A/D lines.
Russell 2000
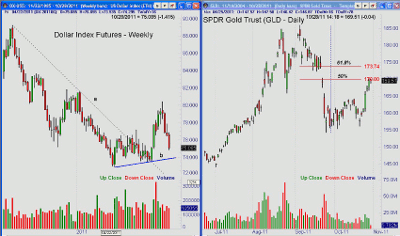
The iShares Russell 2000 Index Fund (IWM) gapped above the 50% resistance level at $73.45 last Thursday, and quickly reached the 61.8% resistance level at $76.60. The next strong resistance can be found in the $80 to $82 area.
The Russell 2000 A/D line moved through its downtrend (line g) on October 10 and has rallied quite sharply. It is acting stronger than prices, and is in a clear uptrend.
There are no signs from the RS analysis that small-cap stocks are starting to outperform large caps, but this is expected to change in the next few weeks.
There is initial support for IWM now at $73.45 (line f), with stronger levels (line e) in the $72 area.
Sector Focus
The Dow Jones Transportation Index has reached the next target at 5,000, which is the 61.8% resistance. The next major resistance is in the 5,350 area.
The RS analysis has bottomed, indicating that the Transports have started to outperform the S&P 500. The first good support sits in the 4,750 to 4,800 area.
The rally so far has been fairly broad-based, and it is encouraging that the Select Sector SPDR Energy (XLE) and the Select Sector SPDR Industrials (XLI) have been so strong.
The percentage change chart (calculated from the October 3 lows) shows that XLE is up 28.7%, while XLI is up 20.3%. Both are doing much better than the traditionally safe Select Sector SPDR Health Care (XLV), which is up just 11.5%.
NEXT: Commodities, Dollar, and Tom’s Outlook
|pagebreak|Oil
Crude oil broke out to the upside last week, and moved towards my next target in the $94 to $96 area.
If you are following the stock market, you also need to keep an eye on crude oil. As I have discussed previously, as well as last week, crude oil will often move a day or before the rest of the stock market. Its strong action early last week was a bullish indication for stocks.
Also, a move to the $98 to $100 area is not out of the question in the next month or so. The weekly and daily technical studies, like the OBV, are positive.
Dollar Index
The dollar index peaked in early October, and has dropped quite sharply since. The weekly downtrend (line a) was broken in June, and the weekly technical studies suggested an intermediate-term bottom was being formed.
If this is the case, the next few weeks will be important, as the weekly support (line b) in the 74 area needs to hold on a further decline.
Precious Metals
The SPDR Gold Trust (GLD) was very strong last week. It has turned around sharply from the support in the $155 area.
The 50% Fibonacci retracement level at $170 was tested last week, with the 61.8% resistance waiting at $173.74.
The daily technical studies are just slightly positive, as the volume on the recent rally has not been impressive. The weekly OBV, which helped pinpoint the September highs, is still negative.
I was looking for a drop down to the $1,500 level in the December Comex gold futures contract before the correction was completed. If GLD closes above the 61.8% retracement resistance, this becomes less likely.
The iShares Silver Trust (SLV) has had a nice rally also, as it has moved through daily resistance in the $31.50 area and partially filled the recent gap in the $32.61 to $34.51 area.
The Week Ahead
Even though last week’s stock-market gains were pretty impressive, I still am looking for a further rally that can last until the end of the year.
Stocks looked like they were going to close lower Friday, but the selling was well absorbed, and they finished in plus territory. This could set the stage for another push to the upside early this week before the market takes a rest.
Patience is the best strategy for those now in the market. There should be another good buying opportunity in the next week or so. Start to work on your buy list now, while the market is completing a short-term top, so you will be prepared once the correction unfolds.
- Don’t miss Tom’s latest Trading Lesson: Demystifying the MACD


