
Our Best Six Months Seasonal MACD Sell Signal for Dow Jones Industrial Average triggered on May 13 when this recovery rally took a brief pause, explains seasonal timing expert Jeffrey Hirsch, editor of Stock Trader's Almanac — and a participating speaker at MoneyShow's Virtual Event on June 10-12.
The rally then resumed adding to May’s gains and putting NASDAQ back in the black for the year and up nearly 5% year-to-date. But the market is bumping into some resistance here technically and looks set to pause again and pullback to recent support levels.
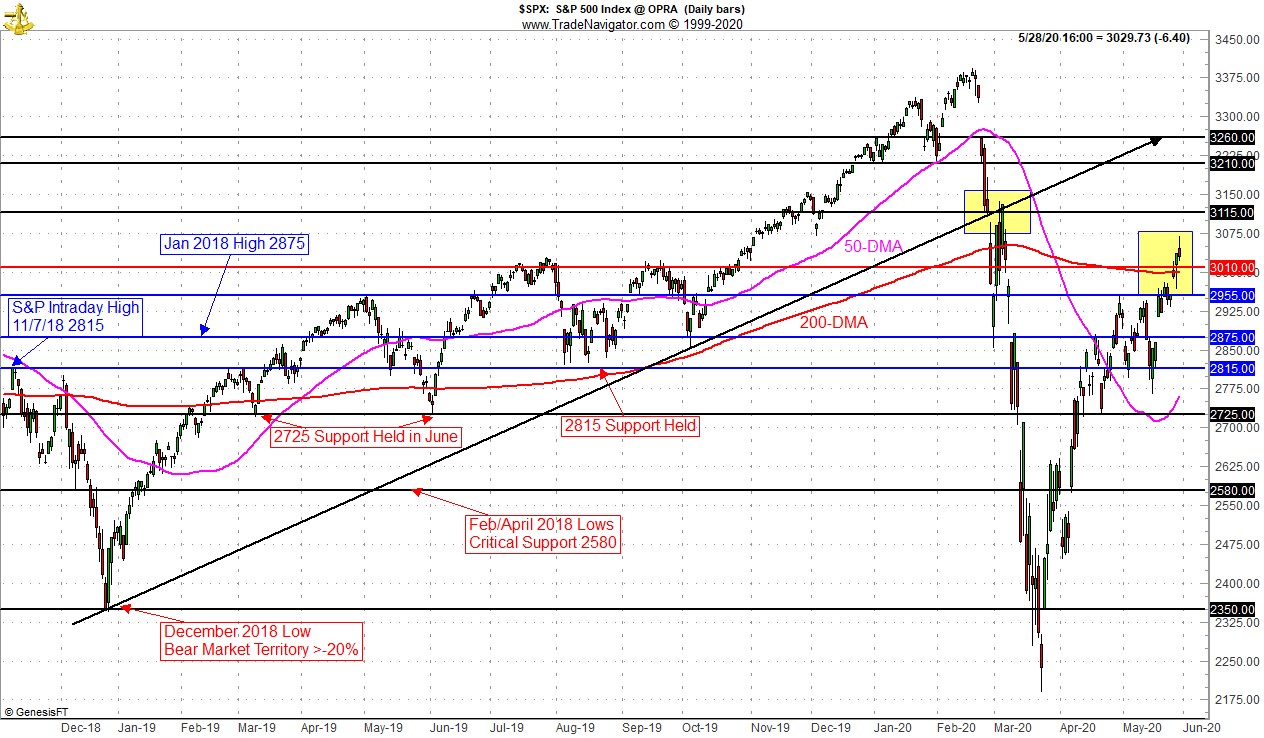
3010 is the level of the July and September 2019 highs. 3010 is also still right at the 200-day moving average.
Above 3010 is 3115 where the big waterfall decline broke below the long uptrend line from the December 2018 low. Any upside above 3115 will likely be hard to come by.
With the country beginning to reopen, traders have been bidding up stock prices in anticipation of rejuvenated economy. Sure there are bright spots, but with the impact of the pandemic shutdown barely hitting the economic data, corporate guidance is not much more than a guessing game. The rally appears to be way ahead of the recovery.

NASDAQ’s Best 8 Months ends in June so we will begin tracking NASDAQ’s MACD Sell indicator for a new negative crossover on or after June 1. After the current turn of the month bullish period from the last few days of May through the first couple days of June is over we would not be surprised if the market retreated.
You can see this historic June retreat in the updated composite graph of the seasonal pattern for the 22 years since 1950 (NASDAQ 14 years since 1971) when both the January Barometer as measured by the S&P 500 were down and the Dow closed below its previous December closing low in the first quarter — known as the December Low Indicator.
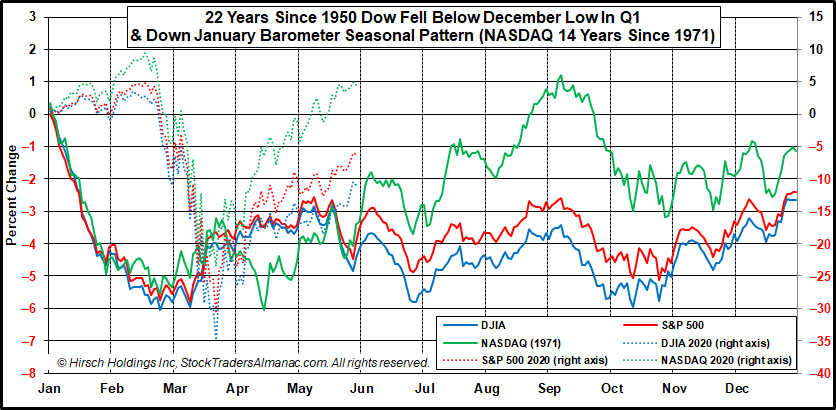
The dotted lines for the indices in 2020 are plotted on the right axis and show that despite the big difference in magnitude 2020 is tracking this pattern of down January Barometers and December Low Indicator triggers.
This supports our cautious outlook for the Worst Six Months (May-October) and our analysis that while the bottom appears to be in, we should expect an overall sideways market bouncing up and down in a range, flirting with testing the lows and stalling at resistance near current levels.
Jobless claims continue to trend lower, which is a good sign we have seen the market bottom as we detailed in the May Outlook.
The chart below shows how the 2020 spike high in claims and rapid retreat is closely correlated with the March 23 low in similar fashion to the previous bear market lows.

But the latest reading of 2.1 million weekly initial jobless claims is still of epic and of historic proportions and brings the total jobless claims since mid-March to a staggering 40.8 million. The unemployment rate is expected to rise beyond last month’s 14.7%. Second quarter GDP is projection to be -40.4% by the Atlanta Fed’s GDPNow model.
So at a minimum we can expect to see some rather unpleasant economic numbers over the next several months. The market also appears to be pricing in a flawless reopening and fast-tracked vaccine solution. And now we are getting some diplomatic machinations with the White House and China. Disappointments on any of these fronts are bound to send stock prices lower.
The good news is that both the Federal Reserve and Federal Government are fully committed to throwing unlimited sums of money at the situation – as are central banks and governments around the world.
Nearly unlimited liquidity from the Fed and massive fiscal stimulus – to the tune of around $9 trillion worldwide so far — will likely prop up the market while economic and vaccine/pandemic disappointments are likely to keep a lid on new highs.
This all reinforces our defensive posture and outlook for a choppy, sideways market over the next several months with the potential for a retest of the lows or at least the lower support levels around S&P 2725, which is near the S&P 500 50-day moving average, and 2580 on the S&P Technical chart above.


