Yahoo! Inc. (YHOO) caught the eye of put traders in the options pits this week, as more than 18,000 of these typically bearish bets had changed hands by mid-morning on Monday alone. What's more, volume swelled to more than seven times YHOO's average daily put volume of just 2,466 contracts. The most active strike has been the January 2011 16 put, where 10,600 contracts have traded on open interest of 28,446 contracts.
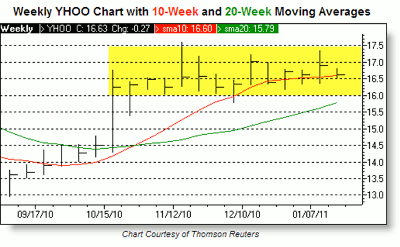
Investors may be betting on a rejection in the $17 region, as YHOO has not been able to maintain a foothold above this area since April 2010. That said, as today's focus trade will demonstrate, other investors may be betting on a trading range for YHOO, as the stock has rarely strayed outside of the $16 and $17.50 levels since mid-October.
While sifting through YHOO's put activity, I found a rather interesting trade at the January 2011 17.50 strike. Specifically, 7,409 contracts traded on YHOO's January 2011 17.50 call at 10:16 am ET on the International Securities Exchange (ISE) for the bid price of $0.13, or $13 per contract. Simultaneously, 7,409 January 2011 16 puts crossed the tape on the same exchange for the bid price of $0.11, or $11 per contract. Given this data, it would appear that we are looking at a short strangle on Yahoo! Inc.
While a long strangle anticipates a sharp move in the underlying stock beyond the purchased strikes, a short strangle is a strategy that requires the equity to remain pinned between the two sold strikes. Basically, a short strangle is a bet that the security will remain in a trading range, thus allowing the sold options to expire worthless, and the trader to retain the entire premium received at initiation.
The Anatomy of a Yahoo! Inc. Short Strangle Position
Getting down to business, the trade breaks down like this: The trader receives a credit of $81,499 for selling 7,409 January 2011 16 puts [($0.11 x 100) x 7,409]. Meanwhile, the trader receives an additional credit of $96,317 for selling 7,409 January 2011 17.50 calls [($0.13 x 100) x 7,409].
So, we have one sold January 2011 16 put for every one sold January 2011 17.50 call, and the trader has pocketed a premium of $177,816 ($81,499 + $96,317). The breakdown for this short strangle position is listed below:
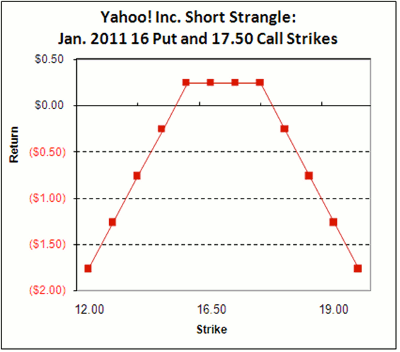
The sweet spot for this trade lies between $17.50 and $16 per share. If YHOO closes within this range on Jan. 22, when these options expire, the trader will be able to keep the entire $177,816 credit, which represents the maximum profit for this trade.
Meanwhile, there are two break-even points for this position. The first is equal to the sold 17.50 strike plus the net credit received, or $17.74 (17.50 + 0.24). The second is equal to the sold 16 strike minus the net credit received, or $15.76 (16 - 0.24).
Finally, the maximum loss is theoretically unlimited to the upside, as there is no limit to how high YHOO could rally. On the downside, losses are potentially heavy, but are limited to the sold 16 strike minus the net credit received. In this case, losses on a plunge in YHOO shares are limited to $15.76, or $1,576 per contract. Below is a chart for a visual representation of this trade's profit/loss scenario:
Implied Volatility
After the short strangle has been established, rising implied volatility becomes the bane of the trader's existence, so to speak. As implied volatility (or “implieds”) increases, the prices of the two sold options also increase, making an exit that much more expensive should the trader need to cut and run. At the time of the trade, “implieds” for the January 2011 17.50 call arrived at 34.80%, while the implied volatility for the January 2011 16 put came in at 28.91%. For a point of reference, YHOO's one-month historical volatility was 16.54% as of the close of trading on Friday (Jan. 7).
By Joseph Hargett, contributor, Schaeffer’s Trading Floor Blog


