The latest options to hit the marketplace are the Nasdaq OMX Alpha Index options. Learn how these options are structured and whether they are a good fit for your style of trading.
There are new options out there called NASDAQ OMX Alpha Index options. This article will explain some of the aspects of this "New Kid on the Block" for option traders.
First, this is not a recommendation to buy or sell of any of these products. The information presented here is for educational purposes only. The accuracy of what is discussed can be verified on the official Nasdaq Web site, as well as Investopedia.com.
Prior to explaining what the new NASDAQ OMX Alpha Index options are, we should first be familiar with what the “Alpha” term actually stands for; so let us define it. According to Investopedia.com, there are two definitions of Alpha. The first dictionary definition states that Alpha is "A measure of performance on a risk-adjusted basis. Alpha takes the volatility (price risk) … and compares its risk-adjusted performance to a benchmark index."
This dictionary definition points out the fact that the performance of any underlying—or a portfolio— can be compared to something else which always acts as a benchmark. The majority of US hedge fund managers compare their performance against the S&P 500.
The second Investopedia definition digs a bit more into the specifics by stating that "A positive Alpha of 1.0 means the fund has outperformed its benchmark index by 1%. Correspondingly, a similar negative Alpha would indicate an underperformance of 1%." From this segment, it is clear that these measurements are done in percentages, rather than in actual dollar amounts or points.
Now let us turn our attention to the new NASDAQ OMX Alpha Index options. At the time of writing, there are seven tradable Alpha option products. However, the NASDAQ OMX aim is to have (in the near future) a total of 19 products, and then even more later.
This is reminiscent of the 1970’s when call options had a similar start. First, there were only 12 optionable products. Then, as calls were added to more underlyings, puts came into existence, with puts being eventually added to every optionable product.
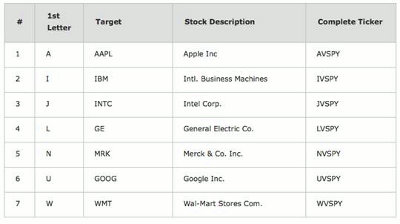
The seven new players are listed in the table below:
The columns in the table above are in order to help you understand these instruments:
- The first column is just a number for reference.
- The second is the letter that represents the target stock being compared with SPY's performance.
- The third column shows the regular ticker symbols for the stock being compared. (The letter in the second column doesn't always match the target stocks’ regular tickers' first letter. A = AAPL; I = IBM; and W = Wal-Mart are the only three that match their ticker’s first letter. The rest of the letters representing the stock need to be memorized.)
- The fourth column names the stock, while the last one spells out the complete NASDAQ OMX ticker. For instance, AVSPY actually means AAPL versus SPY.
NEXT: How the New Alpha Options Work
|pagebreak|How the Alpha Options Work
Next, let us move to the specifics of Alpha Index options. Their full trademark name is NASDAQ OMX Alpha Indexes. They are composed—just as any trading pair—of a couple of components.
The first component is called the target (see Figure 1 above), and the second component is the benchmark. As of now, SPY is used as the only available benchmark, but as the NASDAQ OMX Alpha Indexes increase in popularity, most likely they will add some other benchmarks.
These existing products measure the relative performance of SPY on a percentage basis versus each of the seven individual stocks mentioned above. As of now, they are traded strictly through the Philadelphia Option Exchange (PHLX).
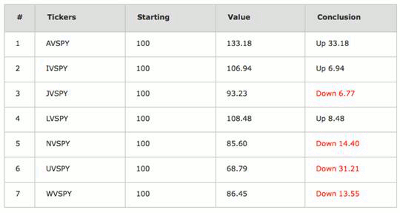
Having said that, let us focus on the value of each "pair." The fact is that when the NASDAQ OMX Alpha Indexes were initially listed, their value was set at $100. As of now, their value has somewhat shifted.
These values represent either a higher or lower value of the current relative performance (price return plus dividends) of the individual stocks versus SPY from where their initial value was when it started trading at a $100 level.
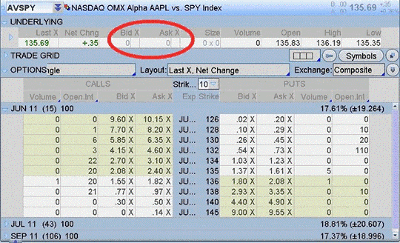
The next figure shows two charts; on the right is the pair which looks at the value of AAPL minus the current value of SPY. On the left is the chart of new NASDAQ OMX Alpha Indexes that compare AAPL versus SPY. Both charts are three months daily. Notice the similarity of the two charts.
Observe how there are only three cycles (June, July, and September) available, and that the open interest, as well as volume, are so low.
Hence, in conclusion, be aware of these “New Kids on the Block,” and learn about them, but do not jump in unless liquidity increases.
Monitor them as they evolve and gain in popularity. Also, to gain some experience, paper trade them for a while before committing any real capital. Be safe and stay informed!
By Josip Causic, instructor, Online Trading Academy


