NYMEX Natural Gas Futures are in the middle of an upside break-out, which options trader Matt McKinney of Zaner Group thinks is long overdue.
Fundamentally, I’ve read over the last several months and maybe years that there is an abundance of supply; Canada is loaded with natural gas, there is so much here in the US that we can't even find places to store it are just a few of the statements I've read. The futures traded that way as well. Last Friday, there was a very interesting article on Marketwatch titled Natural-Gas Cars Merge into Wall Street Fast Lane that stated, "With so much supply that energy companies are pulling rigs out of the ground to cut back on production, natural gas is starting to look more appealing as a cheaper and cleaner alternative to gasoline and diesel." Finally, could it be? I'm an avid watcher of Squawkbox on CNBC that begins at about 5 am central time here in Chicago and a frequent expert and multi, multi millionaire oil mogul T. Boone Pickens has claimed on that show on more than one occasion that natural gas is the only solution to our dependence on foreign oil. That is good enough for me.
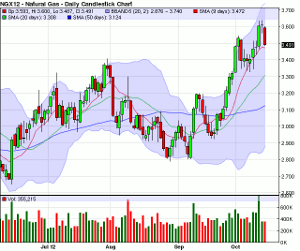
Daily NYMEX Natural Gas Chart
Technically, based on the technicals that I use, which work on any market and any time frame although, nothing works 100% of the time, this natural gas market on this daily chart is in a super-trend up. On about September 12, the 9-day simple moving average (red line) made a cross over the 20-day simple moving average (green line) and that's when I began to watch the market closely, because the cross is the first component to the super-trend up. The next two components occurred on about September 27, which was when the two SMAs, the 9 and the 20, started to point up on sharp angles and the market began to trade above the 9-day SMA. That is when the super-trend up began and it's been that way ever since using the 9-day SMA as support. Please understand this is just my opinion according to the technical indicators that I like to use, obviously there is no crystal ball.
NEXT PAGE: Some Option Plays on the Current Trends |pagebreak|
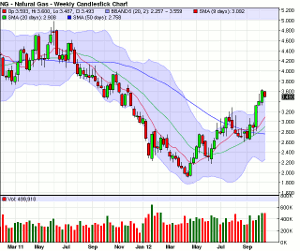
Weekly NYMEX Natural Gas Chart
Technically, in my opinion, we have a natural gas market on a weekly chart that has just begun to show us a super-trend up. It works the same way as on the daily chart. We got the cross of the 9 period simple moving average (red line) crossing over the 20 period simple moving average (green line) on the week of June 11. Now until the week of September 12, we had a combination of a super-trend up and an upward trend in the natural gas market because the market went back and forth using the 9 period SMA as support (super-trend up) and the 20 period SMA as support (upward trend). This made it still a buy, but I like to recommend call options when super-trend up's are in full effect most of the time. This occurred on the week of September 24 when we had a breakout to the upside and the market started to trade well above the 9 period SMA. In my opinion, we could be overbought here and due for a correction because the market is actually trading above the top line of the Bollinger Bands (blue shaded area), but it's also my opinion that markets can remain overbought for long periods of time particularly if they have lots of momentum.
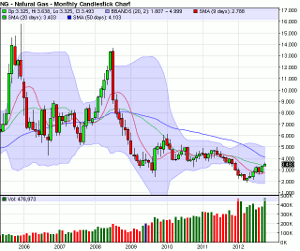
Monthly NYMEX Natural Gasoline Chart
Technically, this monthly NYMEX natural gas chart has only two things that remotely excite me. It is the fact that after years and years of dragging along the bottom in a tight consolidated trading range we finally see a slight change. The first is natural gas futures market on this monthly chart has bounced off of the support of the bottom Bollinger Band (blue shaded area). Secondly, it rallied all the way above both the 9 period simple moving average (red line) and then above the 20 period simple moving average (green line). The other slightly encouraging item is that the 9 period SMA is starting to curl up. Other than that it is a very lagging indicator and not nearly as relative to my options trading style as the daily and weekly charts.
Options Plays
Some potential plays could be to buy bull call spreads and/or outright calls in NYMEX Natural Gas, if we believe the trend is going higher.
I like to recommend to my clients to trade with the trend instead of trying to pick a "top" or a "bottom", but when buying calls or call spreads we also look to buy, in a 3 to 1 ratio, a put for protection in case the market makes a major move against us.
By Matt McKinney of Zaner Group.


