Historical statistics seem to suggest a positive bias for stock returns in the situations similar to the current one, notes Jared Woodard of CondorOptions.com.
In a previous post, we showed that the spread between one-month and three-month at-the-money implied volatility in S&P 500 index options was near the highs for the year. That post also mentioned that it was unusual to see implied volatility term structure so high even while the realized volatility of equity returns has been particularly low.
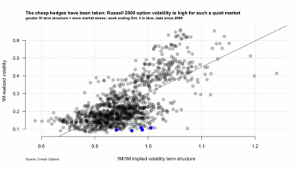
To quantify that intuition, here’s a chart, using Russell 2000 data this time for variety:
Most investors know to look for spikes in implied volatility indexes like VIX. But the term structure of implied volatility moves more slowly, and so is more meaningful—it takes a greater change in sentiment to push ratios of option prices to extremes. Last week, the ratio of one-month to three-month implied volatility in options on the Russell 2000 was in the top quartile versus the last five years of data. At the same time, the realized volatility of index prices was in the bottom decile. The values for days in the week ending Oct. 4, in blue, are among the most distant from the regression line; it is extremely unusual to have IV term structure near backwardation (>1.0) amidst an environment of low price volatility. That’s a convincing sign that equity investors have been reacting very strongly to perceived risk from the debt ceiling. The cheap hedges have already been taken.
But has paying up for those hedges been justified? Since 2007, there were 67 occasions when the term structure of Russell 2000 implied volatility (measured as the ratio of one-month to three-month ATM IV) was greater than 0.95 and the one-month realized volatility of index returns was less than 15%. I chose those parameters by eyeballing the scatter plot, but maybe you could do better by selecting dates with large residuals. Anyway, here are some summary statistics for Russell 2000 returns one day, one week, and one month after days that met the two criteria above.
For comparison, the median overall returns at the same horizons for the index since 2007 were 0%, 0.32%, and 1.4% respectively. That suggests a positive bias for stock returns in these situations, even though we’re not working from a base of high realized volatility. I looked also at subsequent returns for dates meeting the same IV criteria and with 1M realized volatility between 15% and 40%: median returns were the same or worse, with much greater variance and negative skewness.
The counterpoint to all of the above is that markets will probably react really poorly to a Treasury default, and that the magnitude of that reaction could be large enough to dwarf the low probability of the event and the limited likely long-term impact. That’s the reason we haven’t been adding new short volatility positions.
By Jared Woodard of CondorOptions.com


