If you are looking for a methodology that identifies trade set-ups, clearly defines your risk, and also identifies key targets for these trades, you might want to consider using Fibonacci time and price analysis. I will save my explanation of how to apply Fibonacci ratios to the time axis of the market for a future article. In this one, I'd like to focus on the price axis of the market.
As far as the price analysis that I run every day in the markets, there are three different types of Fibonacci price relationships I use. They are price retracements, extensions, and projections. First, I run price retracements of prior swings for possible support or resistance using the ratios of 0.382, 0.50, 0.618, and 0.786. I will also run price extensions of prior high to low or low to high swings using the ratios of 1.272 and 1.618 for possible support or resistance. The third type of price relationship I look at is what I call a price projection which is calculated using three points on a chart. This is where I am actually comparing swings in the same direction. For projections, I would measure a prior low to high swing and project from another low or measure a high to low swing and project from another high. For the price projections, I mostly use 100% and sometimes 1.618. (Many technical analysis packages actually call the tool using three points an extension tool rather than a projection tool. Bottom line, it does not matter what you call it but that you use the tool that will allow you to choose three points to calculate this third type of price relationship.)
By running all possible price relationships on any particular chart, I work to identify one of the three trade set-ups that I look for every day. They are Fibonacci price clusters, symmetry set-ups, and two-step pattern set-ups. The first two seem to be more common than the third.
Fibonacci Price Cluster
This is the coincidence of at
least three Fibonacci price relationships that come together within a relatively
tight range. These clusters identify a key support or resistance decision.
Symmetry Set-up
The definition of symmetry is similarity
or equality of swings in the same direction. We find symmetry set-ups by running
a 100% price projection or "measured move" of a prior swing and then projecting
the results from a new high or low (depending on what direction you are coming
from). The only symmetry set-up I like to focus on is when swings are similar or
equal within the context of the trend. For example, if we are in a clear
uptrend, I will measure the prior corrective declines within an uptrend and
project 100% of those from any new high to help you enter the market in the
direction of the trend. A single symmetry projected is considered a set-up,
though other price relationships may overlap these projections, which only
strengthens the set-up.
Two-Step Pattern Set-up
A two-step pattern set-up is also
a Fibonacci price cluster as it will include the coincidence of at least three
Fibonacci price relationships, but it will be within the context of a zigzag
pattern. I have also written a full chapter in my book on this pattern,
Fibonacci Trading-How to Master the Time and Price Advantage (McGraw
Hill).
The formula for success using Fibonacci Price Analysis is:
Trade Setup +
Trigger = Trade entry
A trade entry is followed up with Trade Management,
which includes defining your initial stop placement and deciding how you will
trail a stop along with defining exit targets.
Trade Setup - Trigger = NO
TRADE
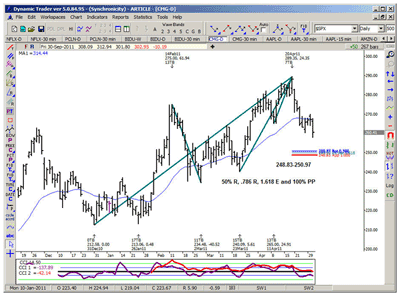
Now let's walk through an example of each one of these trade set-ups starting with a Fibonacci price cluster. This first example is calculated off a daily chart in the stock CMG.
On this chart, we had a price cluster set-up that included the coincidence of four Fibonacci price relationships that came in between 248.83-250.97. The price relationships were:
50% retracement of the 12/31/2010 low to the 4/20/2011 high = 250.97
.786
retracement of the 3/23/2011 low to the 4/20/2011 high = 250.63
100%
projection of the 2/14/2011 high to the 3/2/2011 low from the 4/20/2011 high =
248.83
1.618 extension of the 4/11/2011 low to the 4/20/2011 high =
249.95
****Note: When I run this type of price analysis on a chart, I would actually run ALL of the price relationships from the key swing lows and highs on the chart and then I would look for any confluences of these price relationships. For the sake of this example, however, I am only illustrating the results for actual trade set-up example.
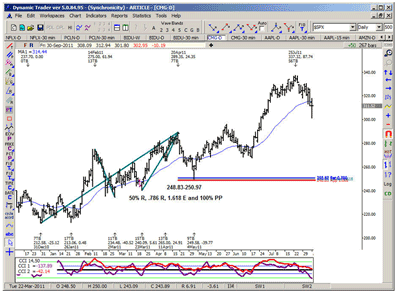
As we moved down into this key price support zone, we watched to see if the price cluster zone held or not. The actual low was made on 5/4/2011 at 249.58, which was directly within the zone. A buy trigger fired off after this low was made and the initial rally off this low was $46.41. The initial risk on the trade would have been defined below the low end of the price cluster zone OR just a tick or two below the low made PRIOR to the buy trigger. CMG eventually went on to rally $87.74 from the price cluster low. The targets for my trend trade set-ups are always 1.272, 1.618, and then 2.618 of the swing into the trade set-up zone. The second chart of CMG illustrates that two targets on the upside were eventually met and surpassed.
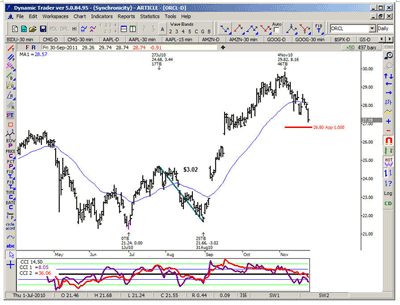
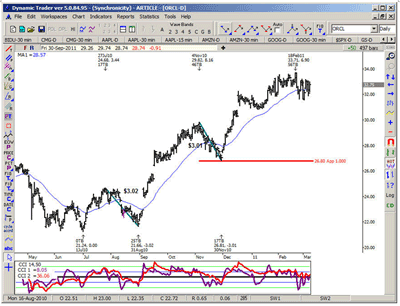
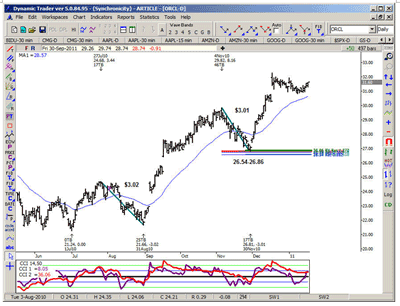
The next example is of a symmetry trade set-up in ORCL. Symmetry is similarity or equality of swings in the same direction. What I did in this case was take a prior decline within the uptrend we were seeing in ORCL at that time. Any time we made a new high in this stock, I would project the prior corrective declines that were seen within the uptrend from this new high. In this case, I projected 100% of the 7/27/2010 high to the 8/31/2010 low was a move of $3.02. The result of this projection gave us possible "symmetry" support at the 26.80 area. The actual low in this case was made at 26.81, which was just one penny above this projection. It was followed by a healthy rally to 33.71, which was $6.90 from the 11/30/2011 low made at 26.81.
Symmetry is such a simple yet very powerful concept. This one projection by itself was considered a trade set-up. If you ran the other price calculations on the chart, however, you would have found the confluence of at least five Fibonacci price relationships that came in between 26.54-26.86. This is illustrated on the third chart of ORCL. The additional price relationships only strengthened the symmetry set-up.
Once again the maximum risk could be defined just a bit below the symmetry projection or the price cluster zone after a buy trigger fired off. The targets for the set-up would have been the 1.272, 1.618, and 2.618 targets of the 11/4/2010 high to the 11/30/2011 low. These targets came in at 30.64, 31.68, and then at 34.69. All three of these targets were eventually met.
Now let's take a look at an example of a two-step pattern set-up. A two-step is a pattern that starts with a trend swing that is followed by a zigzag (two-step) corrective pattern. If the two-step set-up is valid, this should be followed by a resumption of the move that started with the initial trend swing. There are some pretty specific criteria as far as a confluence of at least three Fibonacci price relationships coming together within the context of this pattern, where our risk will be defined.
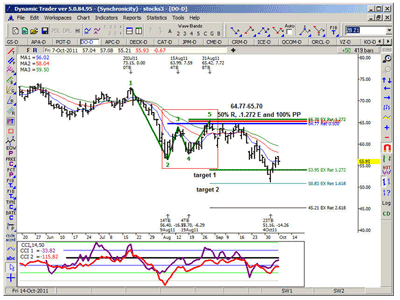
We will be looking for the confluence of three Fibonacci price relationships that come together within a relatively tight range. These price relationships will come from the initial trend swing and then the zigzag pattern that develops after the trend swing. There should be a retracement of trend swing that overlaps a 100% projection of first swing in the zigzag projected from the second swing in the same direction. Ideally, this should also overlap either a 1.272 or 1.618 extension of the middle swing within the zigzag pattern. I know this can be rather confusing, so let's illustrate this with the example in the stock DO.
The two-step pattern parameters were created by the following overlapping price relationships:
.50% retracement of point 1 - 2 which came in at 64.77 (7/20/2011 high to the
8/9/2011 low)
100% price projection of point 2 - 3 projected from point 4,
which came in at 65.29 (8/9/2011 low to the 8/15/2011 high projected from the
8/19/2011 low)
1.272 extensions of point 3 - 4, which came in at 65.70
(8/15/2011 high to the 8/19/2011 low)
The price cluster zone came in at 64.77-65.70.
The actual high was made on 8/31/2011 at 65.42, which was directly within this key price resistance decision. We eventually saw a healthy decline to the 51.16 level, which was just short of the typical second target for one of these trade set-ups.
The preceding examples were all successful trade set-ups.
Now
obviously not all of these trade set-ups are going to hold or play out. Note
that many of these trade set-ups are violated every day, especially if you are
calculating them on an intraday basis. No methodology is 100% accurate. This is
why we filter trade entries with price triggers. If I can get 60% or higher when
using price triggers and trading in the direction of the trend, and I cut my
losers quickly and hold on to my winners, this should be a winning trading
strategy!
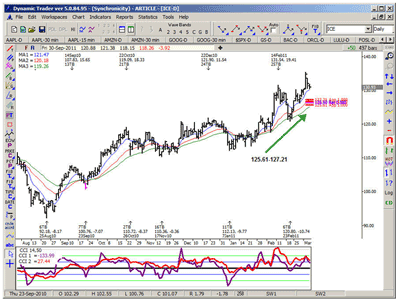
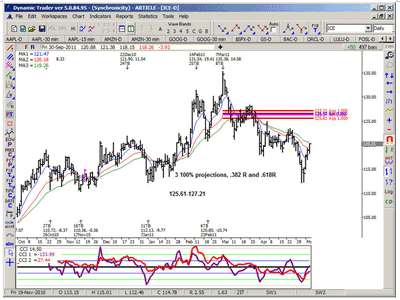
My last example is in the stock ICE. Here, we were looking at a relatively healthy uptrend in the daily chart. A price support cluster that I would have considered for a buy entry in this stock came in at the 125.61-127.21 area. This zone included the coincidence of three 100% price projections, a .382 retracement of one swing and the .618 of another. The trade set-up looked fine in chart #1 of ICE. As you can see by the second chart, however, this stock failed to hold the zone. Any trades taken against this key support decision would have been stopped out as soon as we violated the low end of the price cluster zone at the 125.61 area. The good news is that the risk was clearly defined! A great way to play these set-ups is in the options markets.
Hopefully, these examples give you a good idea of what I search for every day in the way of a trade set-up. My risk and my targets are both well defined with this methodology. For more information on these set-ups, please refer to my book Fibonacci Trading: How to Master the Time and Price Advantage.
Happy Trading and wishing you all great success!

