
The potential that $65-$70 on the price of crude is not just plausible, but likely by the summer driving season. The bullish case for crude falls apart on a decisive break of the $55 price area, asserts Joe Duarte, MD. He’s traded, analyzed and written about the markets since 1990.
If you think 2017 was full of surprises, you better raise your expectation levels for 2018. Given the way the year ended – stocks rolling over and oil rallying – it’s hard to know what lies ahead. But you can make one bet, the potential for a significant rise in volatility in all markets is higher than average.
Who would have expected the Federal Reserve following through with raising interest rates, the GOP actually passing its tax cuts, and the rise of geopolitics as a market influence almost all at once? But that’s exactly what’s happened in the last few days as the year transitioned.
Indeed, it is that last factor, geopolitics, combined with the unknown effects of the tax cut and their impact on the U.S. economy which may increase the flow of money into oil. This may be even more notable as high valuations and flagging momentum sap the advance in the traditional money magnet sectors such as technology.
Indeed, investors will be wise to watch the events in the Middle East and Asia as potential global hot spots may flare to the point of significant political, if not armed conflict. And although I am not expecting a bear market in stocks in 2018, I am expecting some sort of consolidation in the early part of the year. As a result, I am focusing on oil as a potential overweight area of interest.
Crude ends year with a kick
The stock market limped through its last trading day of 2017, but West Texas Intermediate Crude (WTIC) ended the year with a bang. The combination of an unforeseen production shortfall in the most recent supply data from the U.S. government, the arrival of a major winter storm, and a flare-up in the Middle East with Iran at the potential epicenter, gave traders good reasons to push prices higher.
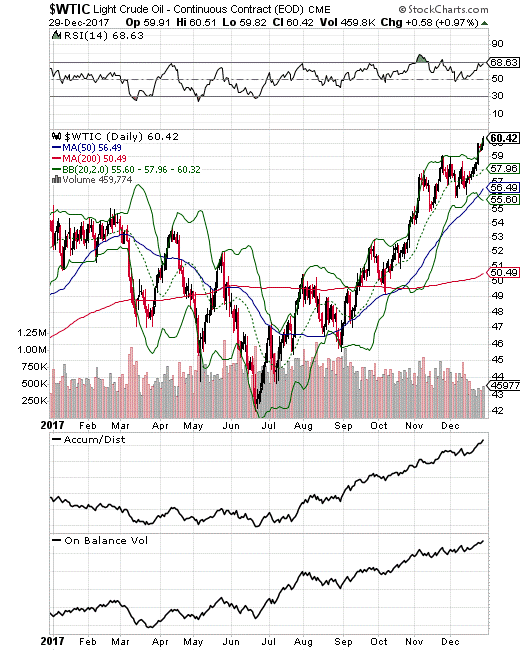
The current price chart for WTIC is a classic study in bullish technical analysis. First, prices recovered all their losses from the July 2017 bottom. Then, after a bullish consolidation, money started moving back in and upside momentum has been increasing with the $60 price area now becoming short-term support and the $55-$58 price band offering intermediate term support. Moreover, from a practical standpoint, as long as prices stay above $55, the bullish case stays alive.
But there is much more to this price chart. Especially positive is the steady uptrend in both the On Balance Volume (OBV) and Accumulation Distribution line (ADI) indicators. In fact, it is the very uptrend and very constructive trajectory of these two key technical factors which suggest we could see the price of crude trade above $70, perhaps within the next three to six months.
Of course, I don’t expect prices to go straight up. Indeed, in the short term, we may see some backing and filling, as the RSI indicator is nearing the overbought zone. I take this indicator seriously, given its record of pinpointing tops and bottoms over the last twelve months.
Under the hood
Investors should choose wisely before putting their money into crude oil at this stage of the advance.
First rallies in the price of crude oil are always about supply. And the potential for a significant supply squeeze, intentional as through OPEC production cuts actually holding, or unintentional such as what may result from some major conflict arising and disrupting supply lines is not a factor which is fully priced in at this point.
In fact, even after a huge run since July, the price of crude is still rising. That suggests that we may actually see a split in the direction of prices, at least in the short term between crude oil and crude oil and related stocks. In fact, even as crude builds momentum, energy stocks may be nearing a price consolidation phase. This conclusion is based on the two price charts below.
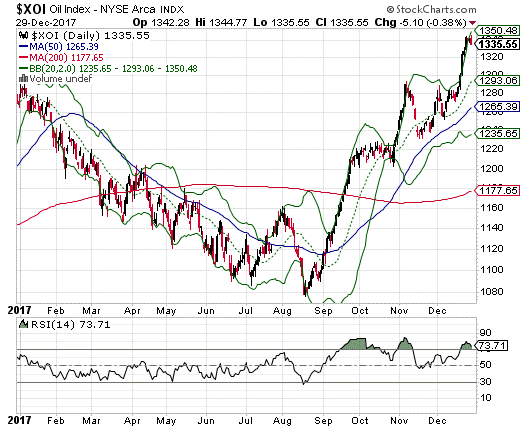
The NYSE Arca Oil Index (XOI), which houses the big cap oil and gas stocks such as ExxonMobil (X) is very overbought with the RSI reaching levels which have led to short-term pullbacks over the last couple of months.
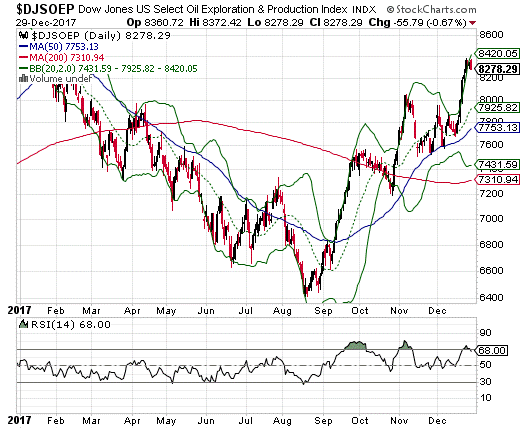
A similar picture is clear from reviewing the price chart for the Dow Jones Oil Exploration Index (DJSOEP), where many of the fracking stocks make their home. Indeed, the fracking stocks seem to be less overbought than their big sisters in XOI.
This suggests investors are a bit more skittish about the international market for crude where ExxonMobil lives as opposed to the shale deposits where the frackers make a living.
Crude may set the bar for the year
I was bullish on crude oil for most of 2017 and I remain in the positive camp for this often overlooked commodity. Moreover, if last year is a clue to the future, I expect crude oil prices to move higher. This may be in fits and starts and may feature oil exploration stocks outperforming the traditional oil names in the early part of the year.
And if I had to make a prediction about the price of crude, I would put some money on the potential that $65-$70 is not just plausible, but likely by the summer driving season. Finally, the bullish case for crude falls apart on a decisive break of the $55 price area.
Joe Duarte is author of Trading Options for Dummies, now in its third edition. He writes about options and stocks at www.joeduarteinthemoneyoptions.com.


