
It is said that markets spend roughly 80% of their time trading in a range and 20% of the time redefining the range or trending. Yet, as humans, we never seem to learn how to react to such patterns, writes Carley Garner Wednesday. Her video: How to hedge with futures.
Without fail, the masses grow overwhelmingly bearish as prices approach the bottom of a trading range and overzealously bullish near the top of the range.
It isn’t often we see this roller coaster of emotion play out as perfectly, and swiftly, as we have seen in the S&P 500 (SPX) in recent weeks.
We will admit, last week as the market gapped higher toward the top of the trading range near 2820, we were optimistic of an upside breakout.
We now know, that was the wrong reaction to the pattern. However, in our view, all is not lost for the bulls. Support levels continue to attract buyers and seasonal tendencies are pointing higher. Further, market sentiment is dismal which might infer that most of the selling has already taken place (by the time people start feeling overly bearish they have probably lightened up their portfolios).
Pessimism could be peaking; at least for now.
Market sentiment is dismal. The CNN Fear & Greed Index suggests market participants are “extremely fearful” on Dec. 12. Likewise, chatter on social media, in trading forums, and throughout television and print news is also highly pessimistic.
We have to wonder if the majority of the selling is behind us. Markets tend to bottom when pessimism is elevated and top when optimism is running rampant. Despite the fact that this correction has been relatively shallow, it seems to have successfully broken the hearts of complacent bulls and that is the stuff bottoms are made of.
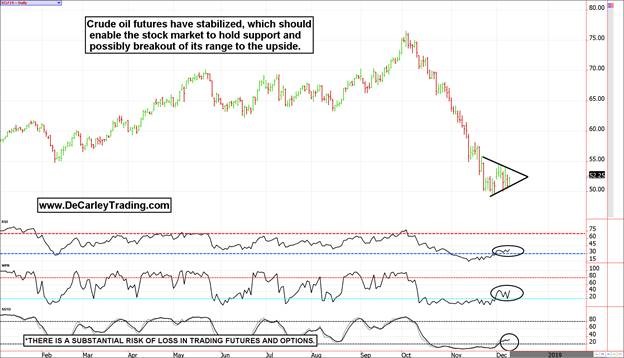
Crude oil has stabilized.
November weakness in crude oil bled into the stock market as investors contemplated whether the selling was demand driven, or simply an oversupply issue.
In our opinion, the drop in oil had little to do with an economic slowdown and everything to do with the fact that supplies are ample, and speculators were complacently long the market and were compelled to liquidate.
Seasonality is supportive.
According to MRCI (Moore Research Center Inc.), going long the March E-mini S&P 500 future on December 11 and holding through the 21st has been profitable 100% of the time in the previous 15 years.
Similarly, going long the NASDAQ future from December 17th and holding through January 3rd has worked out about 87% of the time.
While the net gains generally haven’t been blockbuster, the drawdowns in the ES during these dates haven't been overwhelming either.
In fact, aside from three occasions, the worst drawdown for the E-mini S&P 500 seasonal position was minimal. In summary, even if the market doesn't go up from here, the odds are that it won't go down much further.
If you are short, you should be locking in, or at least protecting, profits. Rallies out of this hole could be swift and if we go back to the top of the range, as expected, we could see 2820ish in short order.
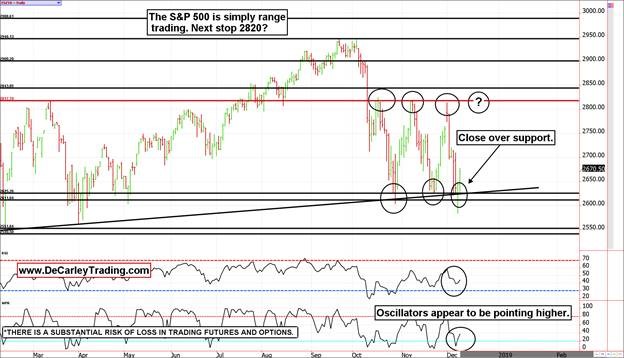
S&P 500 chart
The daily chart of the E-mini S&P 500 futures, which trade 23 hours per day including Sunday evening, portrays a confused market, but not necessarily one in turmoil.
The S&P has been trading violently between 2820ish and 2600 as traders and investors frantically adjust portfolios to match their comfort level but the reality is the even at the lows of the range the S&P is a mere 10% to 12% from all-time highs, which is in-line with most corrections that have occurred since the great recession.
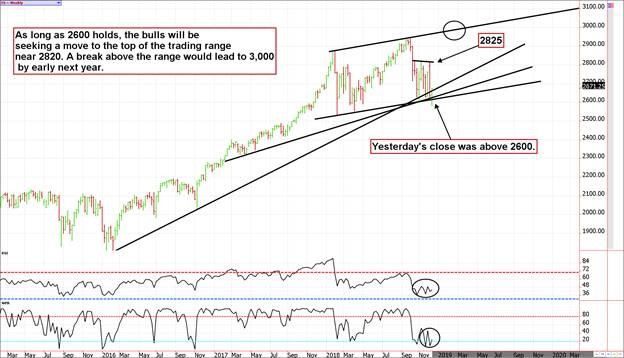
The weekly chart of the S&P 500 suggests that the current daily chart trading range is actually part of a much bigger range that was forged by the late 2017/early 2018 rally and subsequent February 2018 plunge.
Monday’s trade dipped below 2600 but managed to close above it. This is a victory for the bulls and supports higher prices from here. That said, in our view, even a drop toward 2550ish, the early 2018 lows, wouldn’t be a deal breaker for the bulls. The 2017 rally got ahead of itself, so it seems healthy to spend 2018 digesting the gains.
It might not feel possible now, but there is a chance we see 3000 in the S&P 500 by early next year. A breakout of the range above 2820 will likely be hard to stop until we see fresh all-time highs. On the flip side, if we are wrong about the 2550/2600 area holding the slide could see just under 2400 after all is said and done.
Carley Garner
There is a substantial risk of loss in trading commodity futures, options, ETFs. Seasonal tendencies are already priced into market values.
Carley Garner is the Senior Strategist for DeCarley Trading, a division of Zaner, where she also works as a broker. Garner is best known for her contributions to Jim Cramer’s Mad Money; she authors widely distributed e-newsletters; for your free subscription visit www.DeCarleyTrading.com. She has written four books, the latest are the third edition of “A Trader’s First Book on Commodities” (October 2017) and “Higher Probability Commodity Trading” (July 2016).
View a brief video with Carley Garner: How to hedge with futures here.
Recorded: TradersExpo Las Vegas, Nov. 13, 2018.
Duration: 3:31.
View of brief interview of Carley Garner at MoneyShow Las Vegas: How I got started in trading.
Duration: 4:11
Recorded: May 15, 2018.


