
What is the net result for the stock market? The key level is the 78% retracement, writes Jeff Greenblatt.
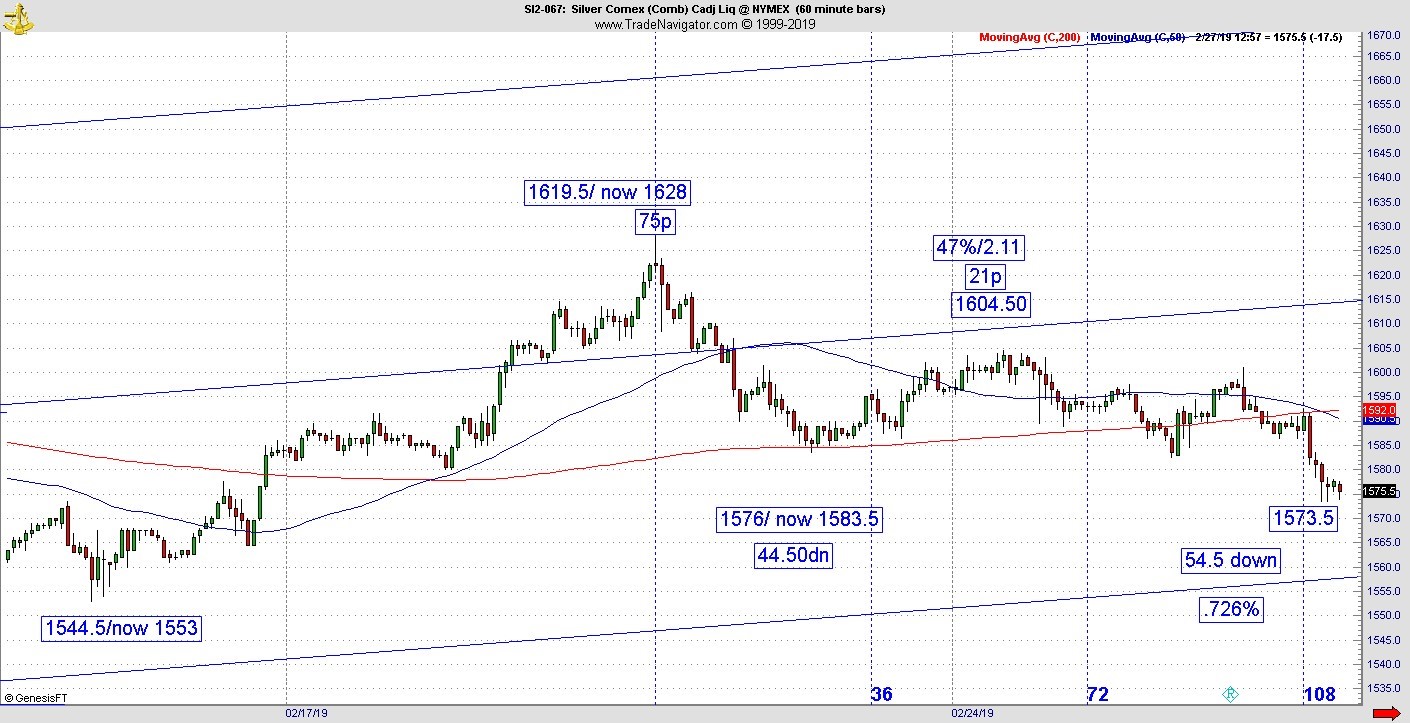
Last week we discussed the potential for precious metals to change direction. They have but the strange condition is the U.S. Dollar Index has not rallied. Upon last observation, Silver changed direction at 75 points up after a prior 75.50 move down which was a 75% retracement against the prior move up. So, it started down, guess where it stopped? By last Thursday the low on the continuation was 1576. So that vibration continued.
Now that the continuation chart has rolled over, we have a new set of numbers. What I’ve done on the chart is show you both sets of numbers where applicable. Whatever the case it appears the 75 vibrational spell could be breaking if they take out the low which just so happens to be 1573.50. If this low holds we’ll have a 54.5 point move against a prior move of 75 points, which is a .726 (rounded 73%) retracement (see chart). Additionally, the 21 point move up to the secondary now has a slash line of 47% and an inverse relationship of 2.11.
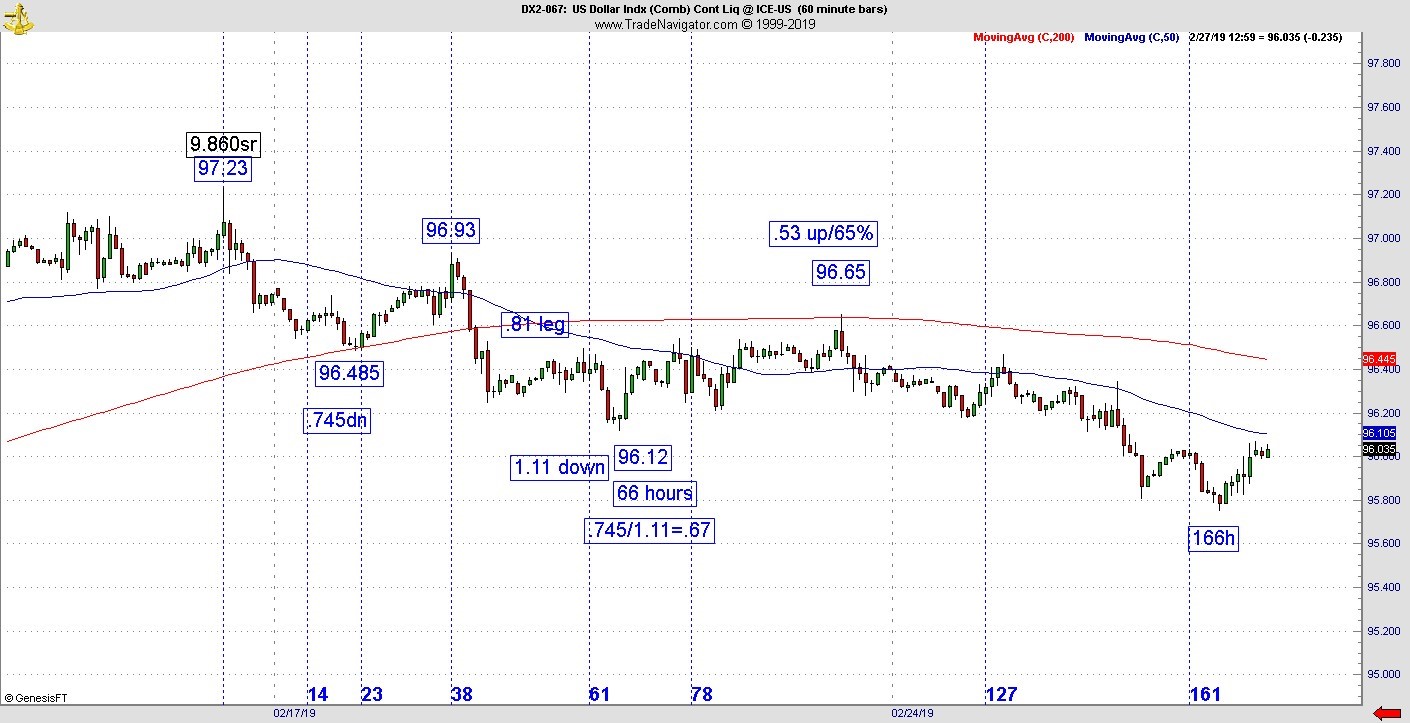
Strange how the U.S. Dollar Index has shown weakness as well during this period. Last week I talked about a 66-hour leg and a small 65% retracement up at 96.65. It continued lower up to Wednesday morning until, you guessed it, 166 hours. One of these is likely to fail.
That leaves us with a stock market that has been getting close to last year’s high. It has stalled with a bunch of charts that have calculations that would allow them to fall more. Officially, across the board we can call it the 78.6% retracement, which many consider to be the last guard at the gate prior to a test of the top. Heading into the last couple of hours, certain stocks were getting hit but overall the move still looked benign.
In the natural, sentiment took a hit Tuesday on a poor housing starts number with December down 11.2%, the worst showing since 2016. USA Today reported from Mastercard that holiday sales were up 5.1% while online sales grew 19.1%. The bottom line is the holiday season was a gift to the economy but seems to have come at the expense of the housing market so it goes to show you the consumer can’t walk and chew gum at the same time. What we’ll need to see how much the housing market can recover post-consumer holiday spending.
What should we be watching going forward?
Oil is at the top of the list. It got hit early in the week when Trump tweeted that OPEC should cool it as he believes prices have gone too high. Seasonally, oil has just about confirmed the seasonal cyclical low. What happened is the pattern retraced back 42% of the drop in 42 days just prior to Trump’s comments. But it has recovered and almost back to the high as the Saudis seem to have rebuked Trump’s tweet. But the readings were there for a hit and we’ll find out in a day or two whether it was just a shake of the trees.
The stock market might turn on whether oil gets hit again. On Wednesday morning odds favored further upper testing given a few key relationships were violated on Wednesday’s rise. Without the oil sector, it will be harder for stocks to sustain. This is the one area that suddenly became vulnerable. The crowd is also paying attention to U.S. Trade Representative Robert Lighthizer who hinted a deal with the Chinese is not certain. I’ve long told you it will be a long process with many twists and turns. When I see it, I’ll believe it. Of course, trade tensions will be lower right now as Trump pushed back the March deadline on additional tariffs for Chinese goods. Of course, he did, he’s meeting with Kim Jong Un as I write this.
What is the net result for the stock market? This is a very key level, the 78% retracement. It makes sense markets would stall here. They could consolidate more and it would be perfectly normal given the fast run up to these levels. We haven’t seen a real distribution day in a while and we need to have one to see a pullback that is more substantial. This is also the level where the entire bear hypothesis gets questioned.
With the bear move at roughly 56-58 days on a lot of charts, last month I told you not to get concerned until the pattern got to at least a 6%-time retracement. At 55 days, a 61%-time retracement is 34 days. The Dow is now up 41 days after a drop of 58 days. They are now at a 70%-time retracement so enough time has passed to start considering whether the bear phase was just that, a moment in time. Until we get a distribution day, there isn’t much cold water to pour on this pattern. That being said, complacency is high but that’s a condition that could last a long time.


