
The QuantCycle Oscillator is showing near-term equity weakness and a longer-term equity high is on the way, notes John Rawlins.
After selling off the week of March 3, equity indexes rebounded last week and once again are sitting at key resistance areas that could determine if the bull market has resumed or if the marketing is ready for a resumption of the Q4 sell-off.
A quick look at the QuantCycles charts of the E-mini S&P 500 and Nasdaq 100 is not encouraging for the bulls.
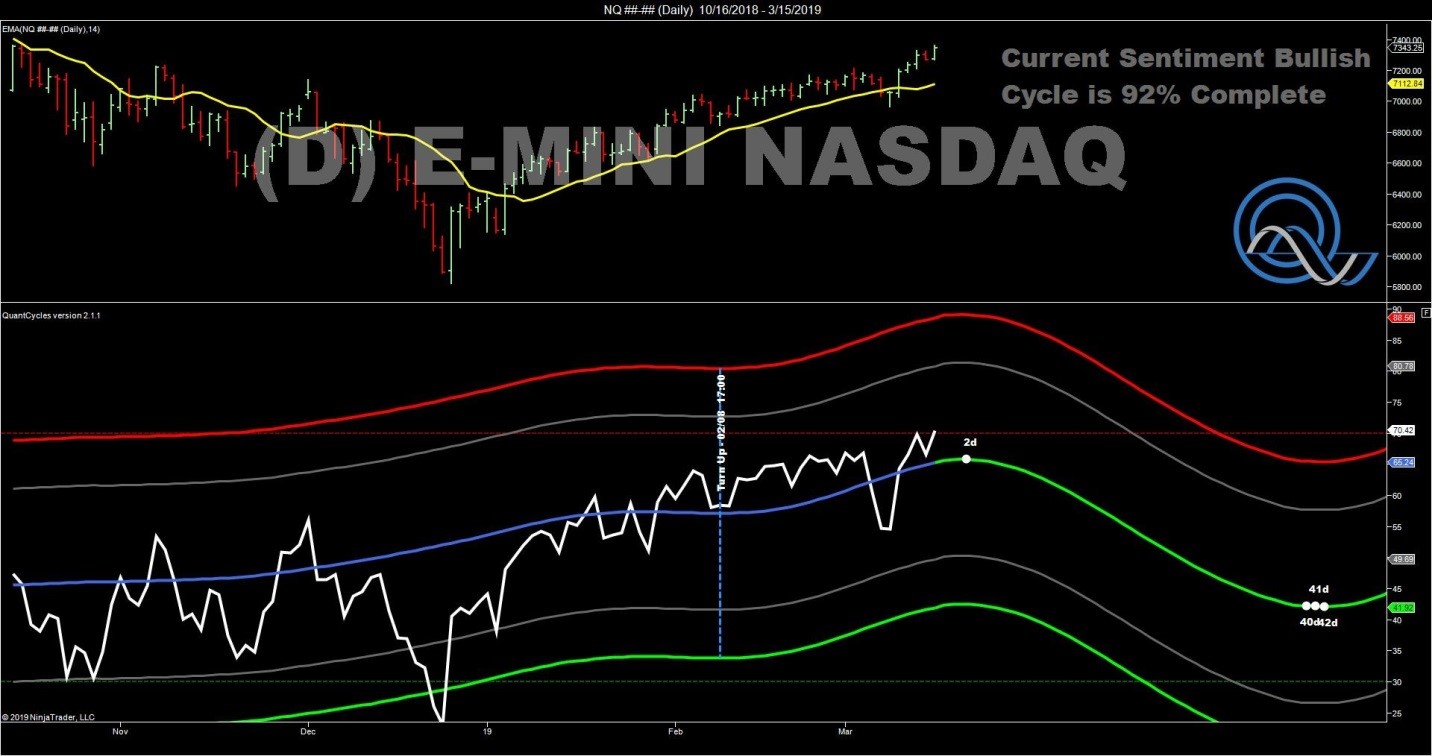
The QuantCycle expects the Nasdaq 100 to make a top early in the week, before a six-week long downturn.
When we look at a shorter timeframe, more near-term weakness appears.
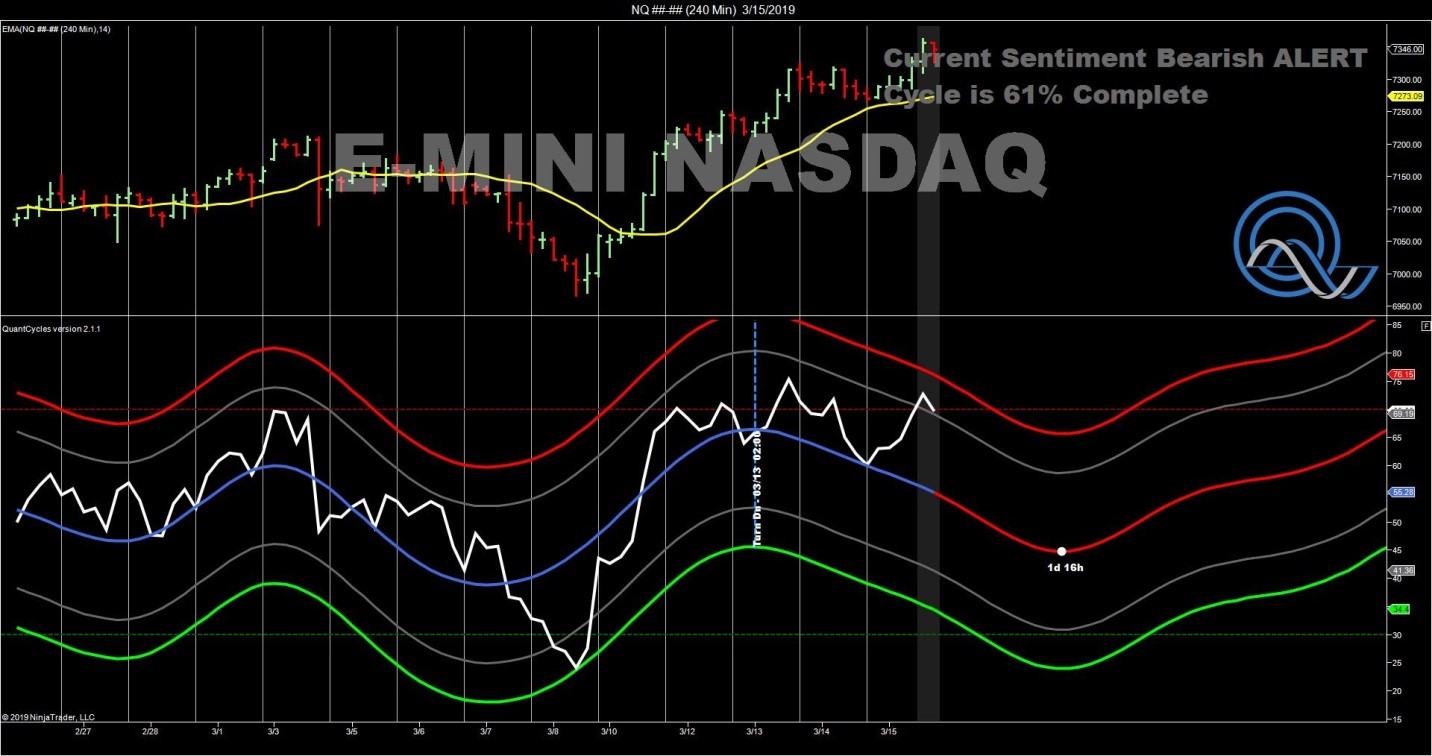
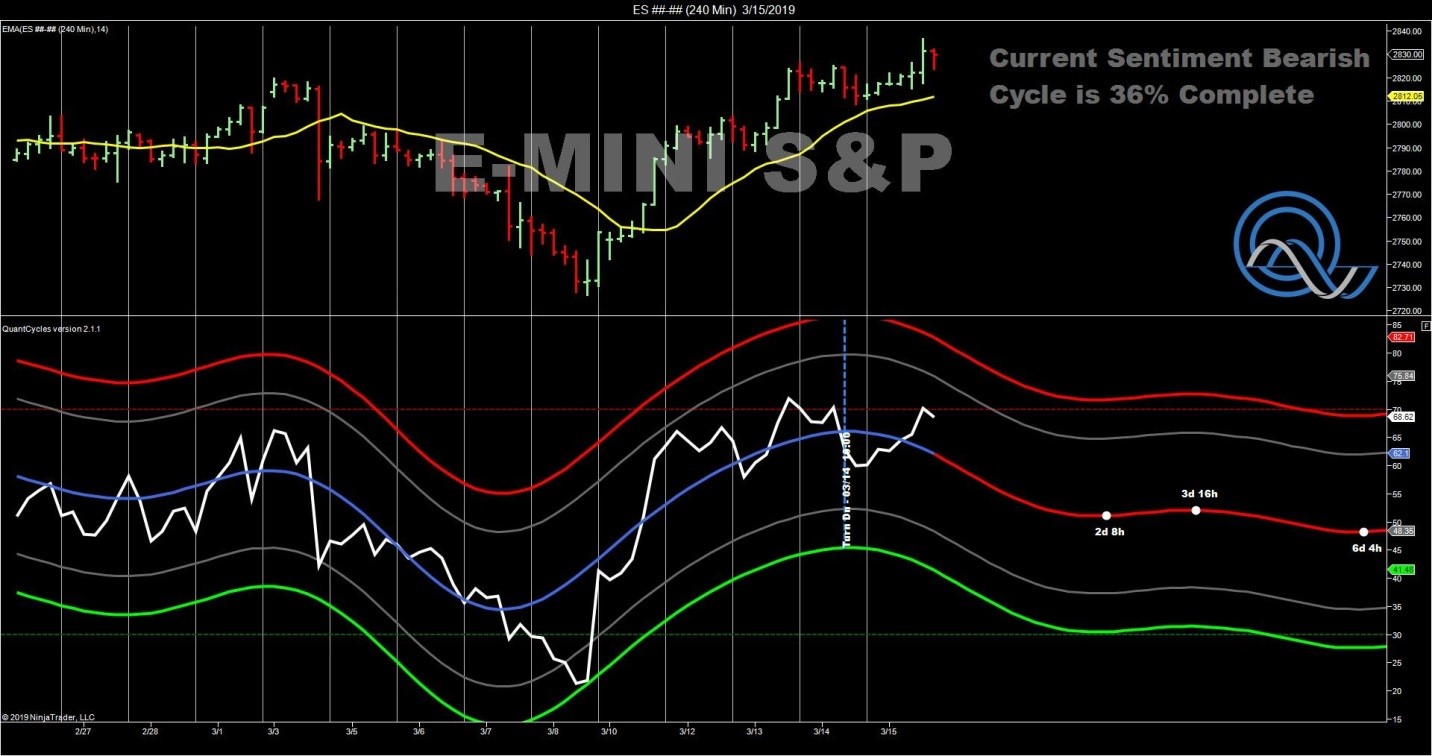
Both the E-mini S&P and Nasdaq are nearing overbought territory and the QuantCycle is forecasting a move lower.
Volatility Anyone?
Since neither chart was extremely dramatic, we thought we would confirm sentiment by looking at the Cboe Volatility Index (VIX).
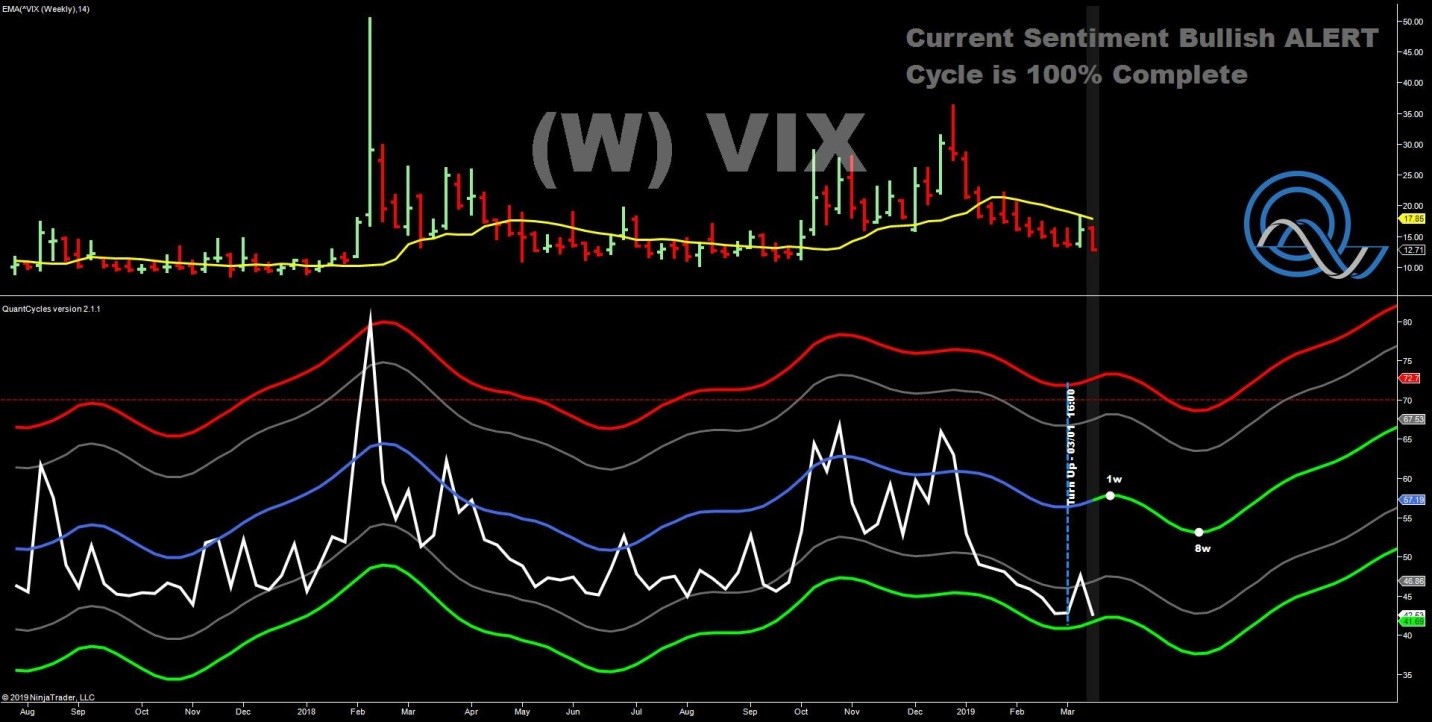
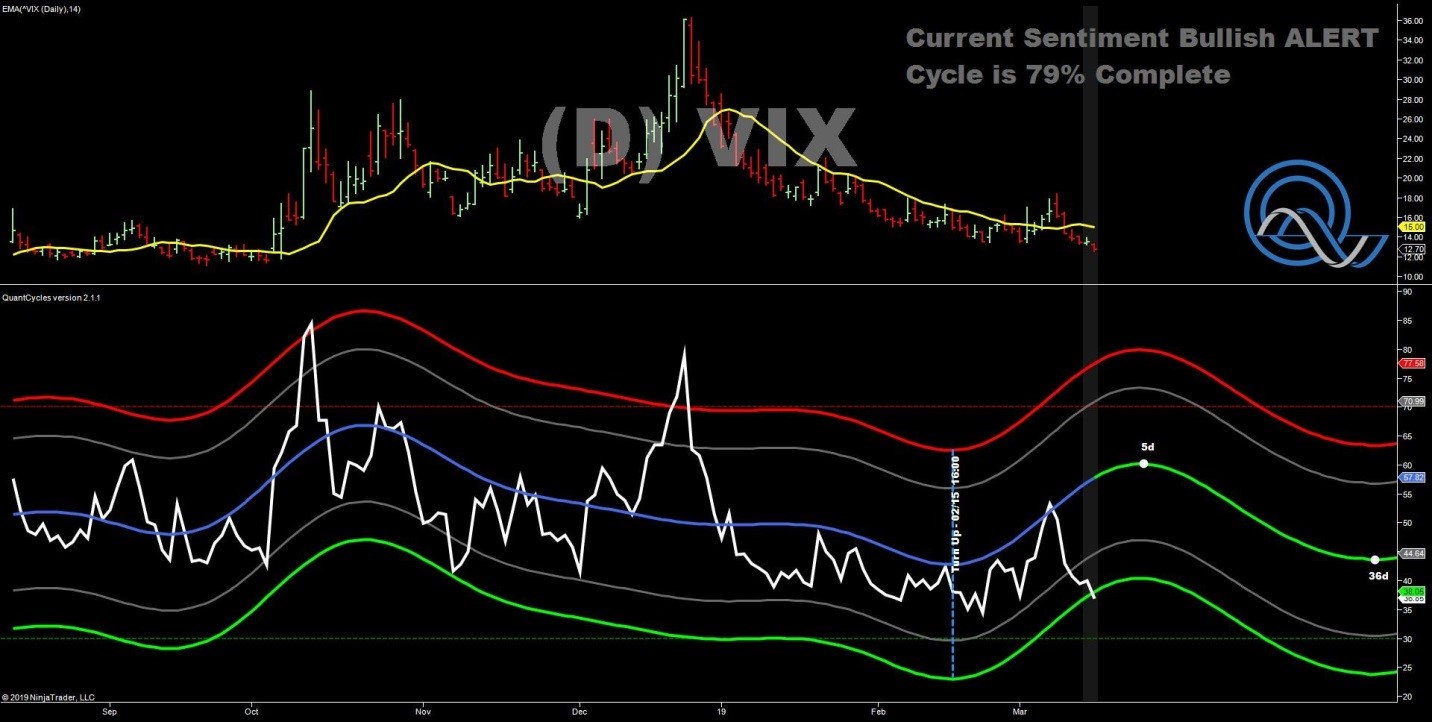
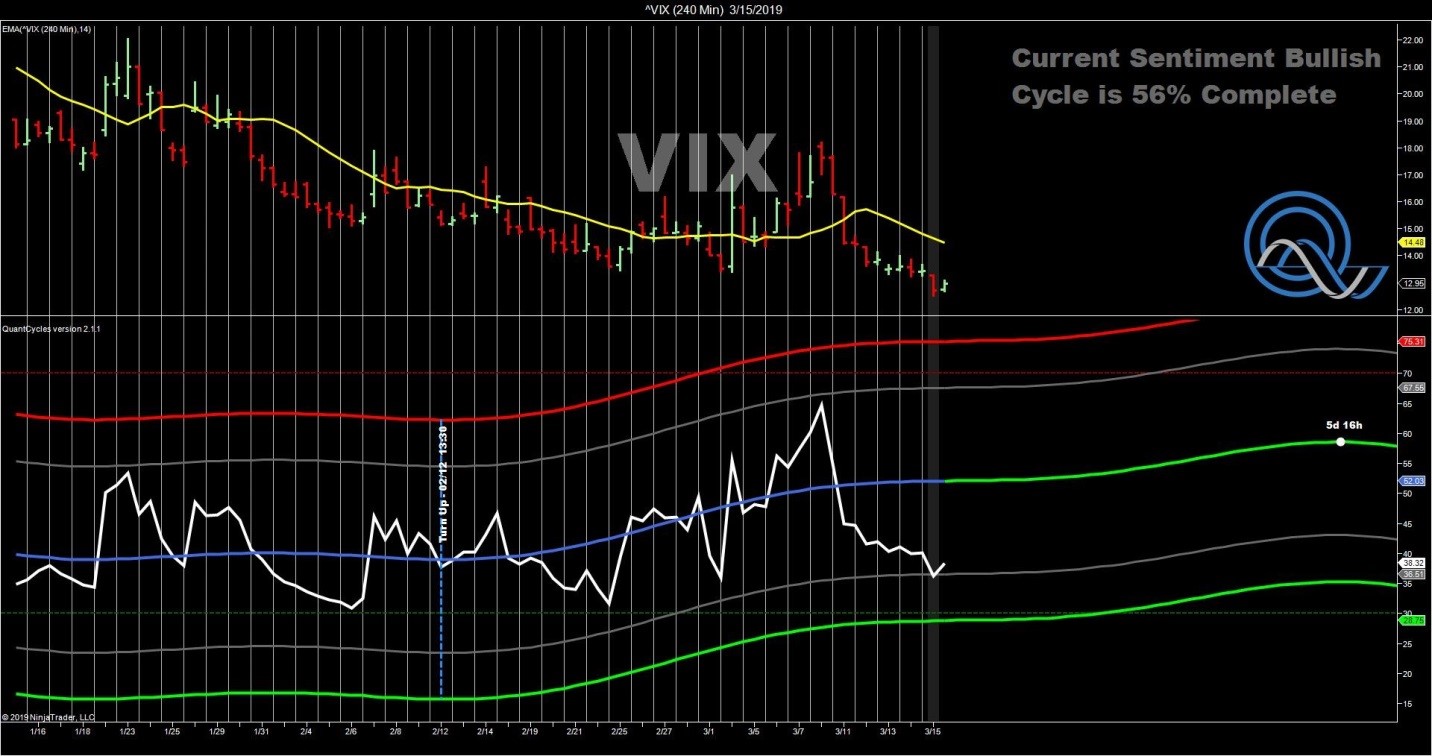
As you can see, the VIX appears oversold on a short-term (240-minute), medium term (daily) and long-term (weekly) timeframe. This supports our analysis of potential weakness in equities for the week.
While the QuantCycle is predicting the VIX to move higher for the weak, there are additional insight in the charts. The daily chart arguably has the most dramatic reading and is indicating the VIX will rally (and consequently stocks will fall) in the weak ahead. It also indicates that it will be a short-term move that will reverse the following week.
This is confirmed with the weekly chart, which shows only a small upward blip before reversing. The weekly VIX expects volatility to shrink and make a potentially significant bottom around the middle of May. This has the potential to be a major market top (VIX low).
We will keep you updated, but right now the weekly QuantCycle VIX chart is screaming sell in May and go away.
John Rawlins described the value of the QuantCycle Oscillator recently at The Orlando MoneyShow.
The QuantCycle indicator is a technical tool that employs proprietary statistical techniques and complex algorithms to filter multiple cycles from historical data, combines them to obtain cyclical information from price data and then gives a graphical representation of their predictive behavior (center line forecast). Other proprietary frequency techniques are then employed to obtain the cycles embedded in the prices. The upper and lower bands of the oscillator represent a two-standard deviation move from the predictive price band and are indicative of extreme overbought/oversold conditions.


