
The trendline that has served as a magnet for crude oil futures ever since being breached in the 2014-15 crude bear market is back in play, and has been taken out!
Back in 2014-15 I made an interesting discovery while following the crashing crude oil market.
I drew a trendline from the 1998 low of $10.68 touching the January 2002 correction low and the January 2009 correction low. In late 2014 the WTI crude oil futures contract was quickly approaching this trendline (see chart). Given its length, it had to be a significant level. At that point the trendline was sitting somewhere between $46.50 and $47.
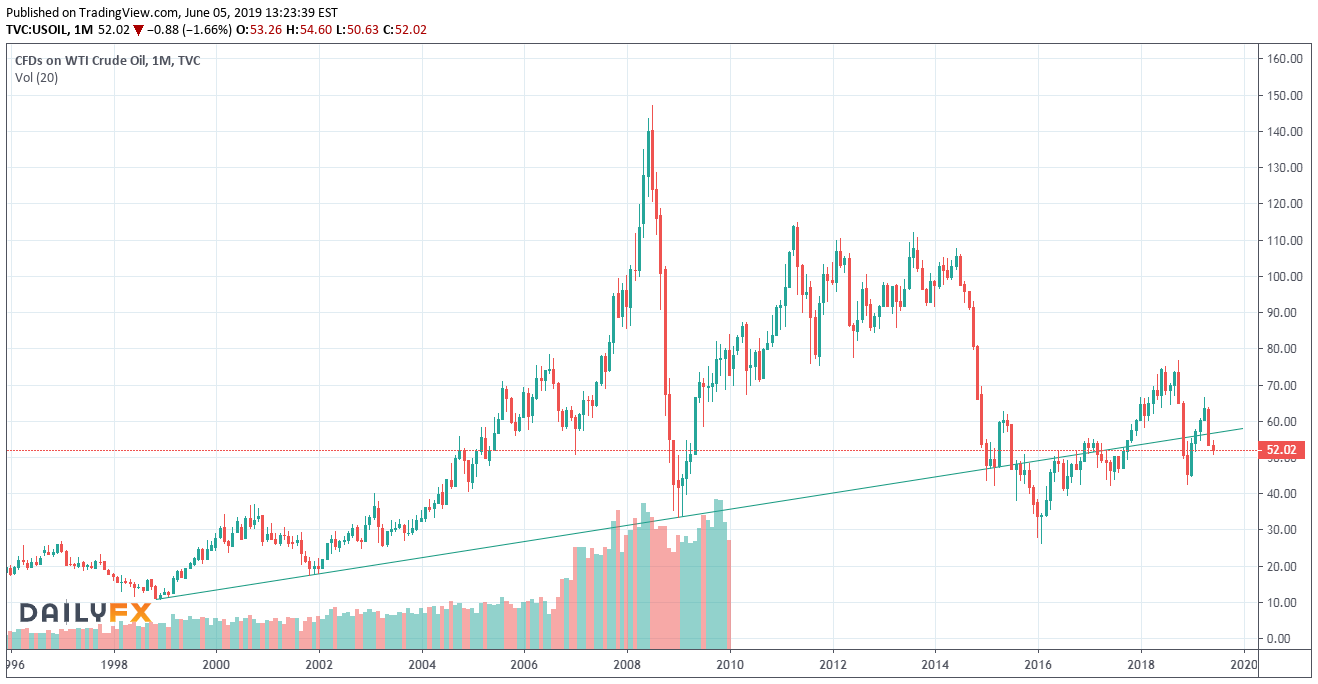
In late January 2015 the crude oil selloff continued lower and breached the trendline. Because it was such a significant level I was watching it closely as we approached month end. It seemed inevitable that crude oil futures would break the trendline sending an extremely bearish technical signal to traders.
Benchmark Trendline
What ended up happening was more interesting. On Jan. 31 with just an hour of trading left in the day, crude oil staged a massive rally, moving more than $3 in less than an hour to settle on the monthly bar slightly above the long-term trendline.
The question of whether this was a significant level was answered emphatically that afternoon. For the next several months the crude oil market toyed with the trendline, which appeared to be a magnet, particularly near the end of each month.
Finally in July 2015 crude oil settled below the trendline. In August, after trading well below the trendline for most of the month, it vigorously fought over the level at month end and lost the battle. This led to a 15-month stretch where crude oil traded below the trendline, punctuated in the middle with another failed test of the trendline.
Crude oil remained above the trendline — though hovering near it —for three months before once again falling below it in March 2017. It would remain below—though consistently testing it—until October 2017.
At that point crude busted through and rallied to a high above $70 by June 2018. (Oddly enough, if you drew the same trendline over the same period on the closing lows instead of the outright lows, it serves as resistance at the top of the 2018 trading highs).
The late 2018 selloff in crude breached the level on the November 2018 close. Crude remained below the trendline until February 2019. After a four-month uptrend, crude once again settled below the trendline in May.
The trendline is sitting at about $56.50 at this point. If history is a lesson crude oil is likely to rally at the end of June and test the level. It will most likely fail and began a protracted period under the trendline. Remember that the trendline acts like a magnet to price so technical traders will likely try and test it near the end of each month.


