
The QuantCyclces Oscillator is expecting a spike in volatility over the summer, writes John Rawlins.
Volatility has declined over the last week as the market rebounded on the promise of interest rate cuts coming sooner rather than later.
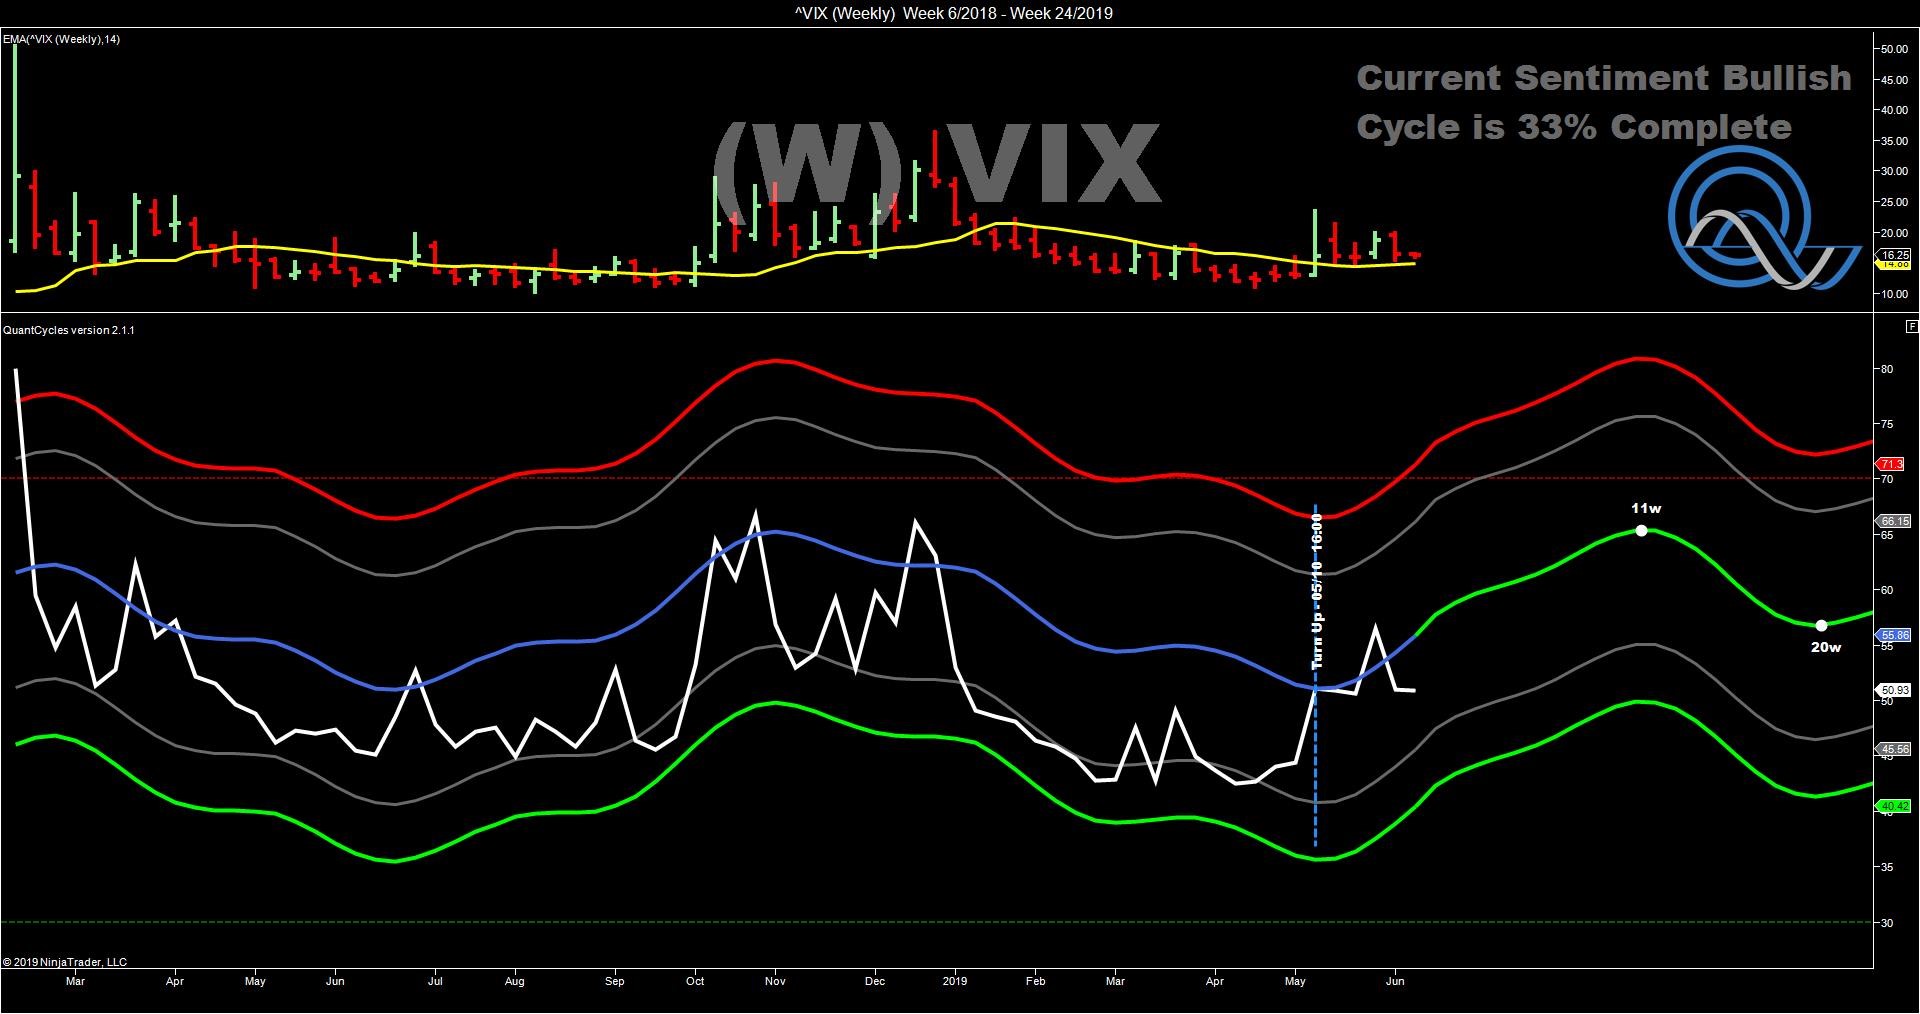
However, the decline in volatility as measured by the Cboe Volatility Index (VIX) is going against the near-term and long-term QuantCycles Oscillator.
The weekly QuantCycles chart shows volatility rising for the remainder of the summer (see chart).
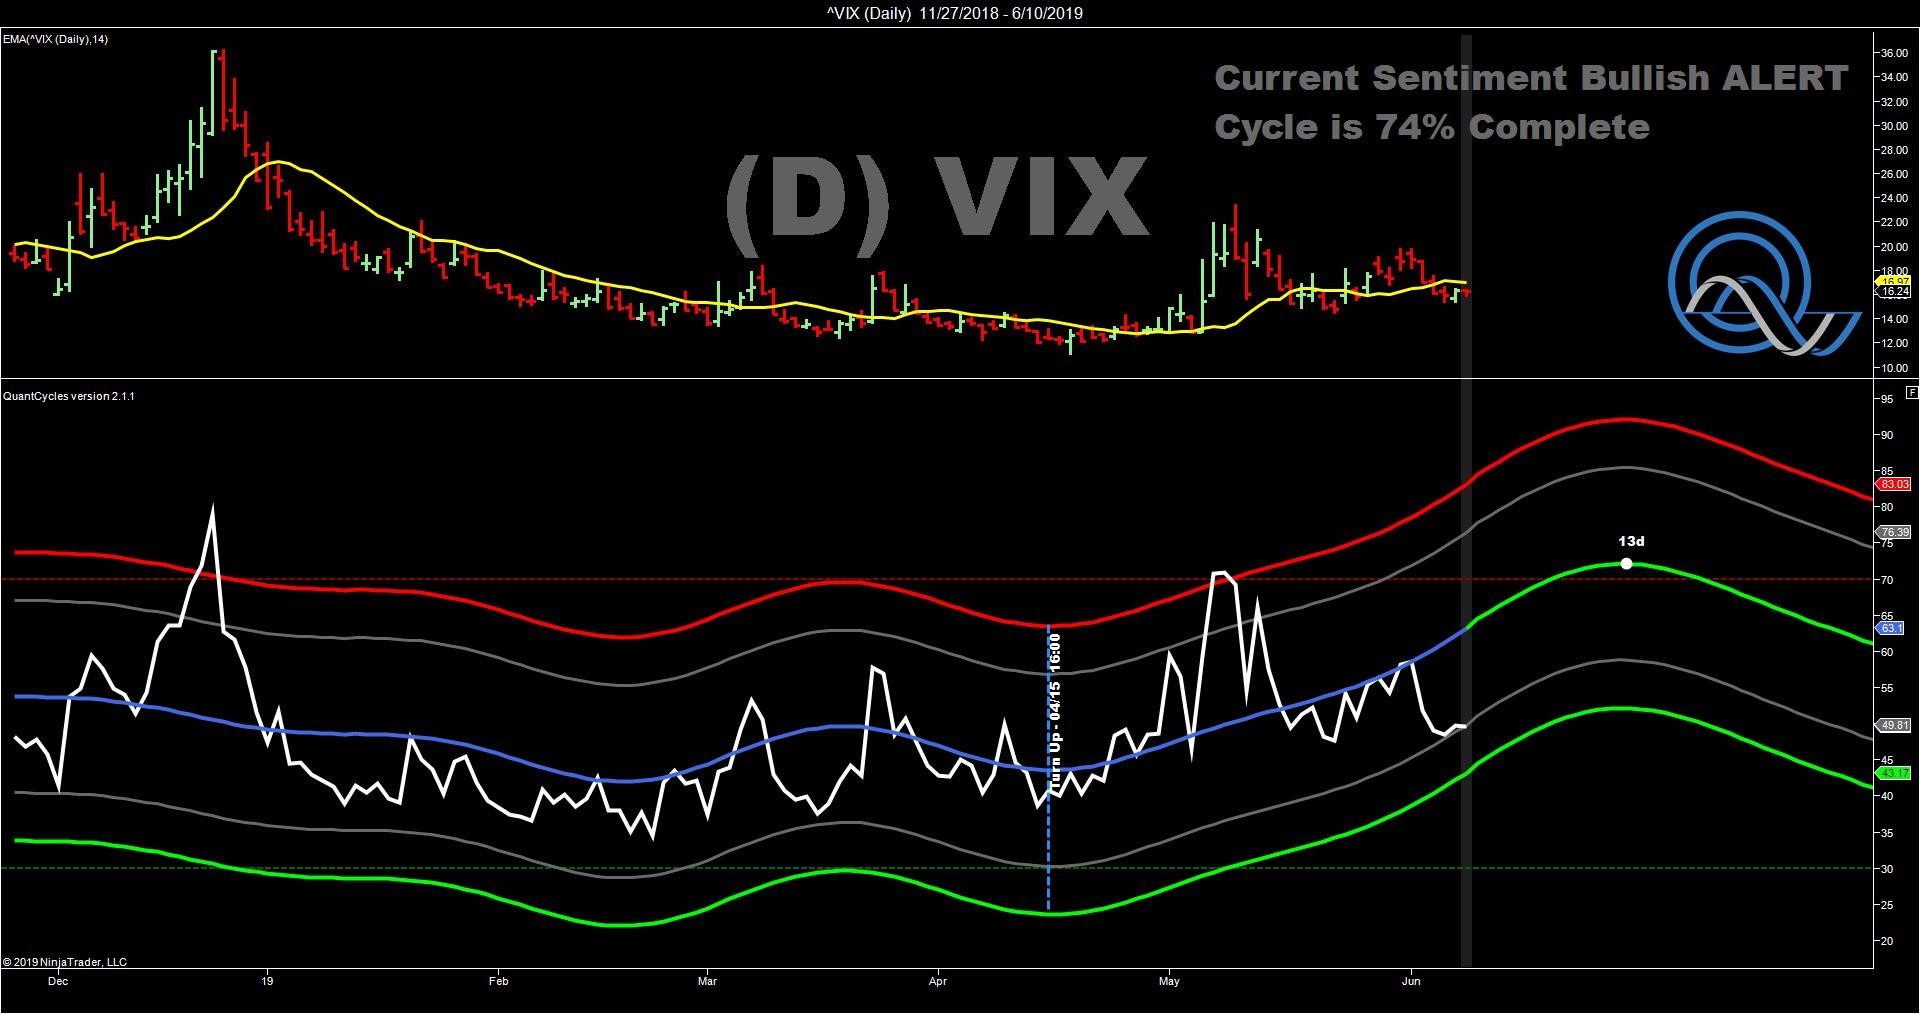
The daily oscillator is more compelling, indicating that the VIX is nearing oversold territory and heading higher for the next three weeks (see chart).
While the recent strength in equities is compelling, it has been based in part on the weak economic data pushing the Federal Reserve to cut interest rates. The Fed will only do so if they confirm a weak economic outlook, which is anything but bullish.
The QuantCycles Oscillator is indicating the VIX will rise this in the near-term and for the rest of the summer.
GOOD CALL
A week ago today, we shared a tremendous buying opportunity indicated by the QuantCycles Oscillator in Amazon (AMZN). That was a strong call as Amazon has rallied more than $130 since last week.
We hope you took advantage of it!
John Rawlins described the value of the QuantCycles Oscillator recently at The Orlando MoneyShow.
The QuantCycles indicator is a technical tool that employs proprietary statistical techniques and complex algorithms to filter multiple cycles from historical data, combines them to obtain cyclical information from price data and then gives a graphical representation of their predictive behavior (center line forecast). Other proprietary frequency techniques are then employed to obtain the cycles embedded in the prices. The upper and lower bands of the oscillator represent a two-standard deviation move from the predictive price band and are indicative of extreme overbought/oversold conditions.


