
The E-mini S&P 500 reversed up sharply for two days after a sell climax down to below 2800. It will probably go sideways for a couple weeks.
The E-mini S&P 500 futures already has a big range in August. There is currently a bear body on the monthly bar, but with a big tail below (see chart). August is not particular bearish at the moment on the monthly chart.
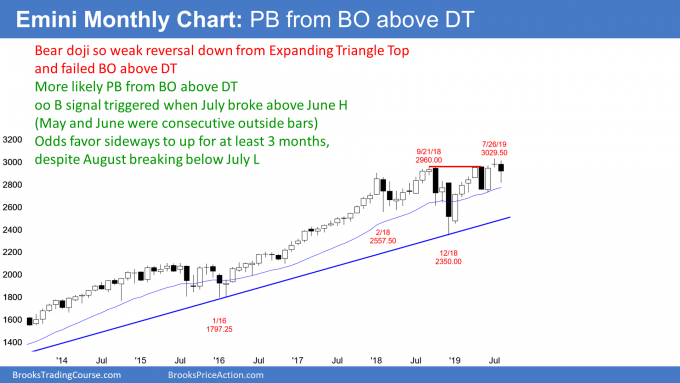
As strong as the selloff has been on the daily chart, it is still more likely to be a pullback in a bull trend than the start of a bear trend on the monthly chart. This is because July triggered an “OO” (outside up bar after an outside down bar) buy signal. May was an outside down month and June was an outside up month. Once July went above the June high, it triggered the buy signal.
I have been saying throughout July that there is a 60% chance of three months of sideways to up trading. I chose my words carefully. Sometimes the E-mini will go sideways instead of up. With the August selloff as strong as it has been, the three months will probably not be strongly up.
What happens after September? The effect of the “OO” buy signal wanes and traders begin to look for the next pattern.
Expanding triangle top
We’ve highlighted the expanding triangle top on the weekly and monthly charts for weeks now. This is a major trend reversal pattern. Like all major patterns, there is only a 40% chance of an actual major reversal from a bull trend into a bear trend. The majority of major tops and bottoms go mostly sideways. Traders then look for the next pattern to buy or sell.
There is still a 60% chance of a break below the December low within three years. But there is not much risk of that happening until at least after a test of the all-time high, and probably not for many more months.
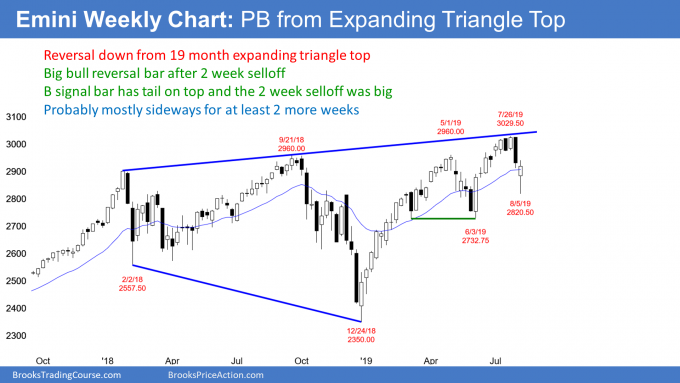
The E-mini S&P 500 futures gapped down last week but reversed up strongly from far above the June low on its weekly chart (see chart). It closed the big gap down and it is now a buy signal bar for next week.
But the tail on its top and the strong two-week selloff weaken the buy setup. All through July it was clear that there would be at least a two- to three-week selloff. The size of the selloff makes three or more weeks of sideways trading likely.
Limit order, scale-in bears
In the first week of June, the E-mini reversed up strongly with an outside up bar. The last week of May was a big bear bar closing on its low. It was reasonable for traders and algorithms to sell with a limit order at the top of that bear bar because it was a low probability buy signal bar.
In a situation like that, experienced traders know that some bears will sell more (scale-in bears) as the E-mini goes higher. They are confident that if they do something reasonable, there is an 80% chance of avoiding a loss or making a profit. This type of scaling in often requires a wide stop. Traders expect an eventual pullback to below the top of the bear bar where they began to short.
This is what happened this week. The selloff to below the top of that May bear bar allowed the bears to buy back their first shorts at breakeven. They made a profit on their higher shorts. Remember, the bears are buying the selloff down to the top of that bear bar.
What do the bulls do? They buy as well. They know that the E-mini rallied in early June once it broke above that bear bar’s high. Traders are betting that there will again be buyers at that price. If many bulls and bears buy at the top of that big bear bar, you get a week like this past week.
Will this week be the end of the selloff?
The Big Up in July has been followed by Big Down in August, and now by Big Up again. That typically creates big confusion. The surprisingly strong bears on the daily chart (see below) make traders wonder if the bears will sell again back around the September/May double top at 2960.
Bear surprises typically have at least a small second leg sideways to down. Therefore, if this week is a rally in a developing trading range for the next few weeks, traders should expect it to fail around where the E-mini sold off in September and again in May.
As strong as this week has been, there is currently only a 50% chance that the E-mini will go straight up to a new high without at least a small second leg sideways to down within the next couple weeks.
The daily E-mini S&P 500 had a strong bull breakout in early June on the daily chart. A bull breakout is a spike. Once there was a pullback, the breakout phase ended, and a bull channel began. That happened on June 12.
A bull channel has a 75% chance of a bear breakout and then a transition into a trading range. This is how the Market Cycle typically behaves. That is why I said throughout July that a selloff was likely. A strong trend (breakout) weakens and becomes a channel. The chart then transitions into a trading range. At that point, the process starts over. Traders look for the next breakout up or down.
The bottom of the trading range is usually around the bottom of the first pullback. Last week the E-mini fell below that June 12 low and reversed up.
Wednesday formed a micro double bottom with Monday’s low. The reversal up this week was strong enough to make traders wonder if the selloff was just a brief, sharp pullback in the strong bull trend that began in December.
What do the bulls need?
A small double bottom after an extremely strong selloff is usually not enough of a foundation to support a bull trend. There typically will be at least one more leg sideways to down. If the bounce is weak, the second leg down can fall far below the first. Also, there is often a third leg down to a wedge bottom. That would be a Spike and Channel Bear Trend.
However, this week’s reversal up was as unusually strong as was the two-week selloff. It makes it likely that the low is in or that there will be buyers not far below last week’s low. But there is only a 50% chance that this rally will go straight up to a new high.
This week will be important. If the E-mini hesitates for a few days, it will probably test back down and retrace about 50% of the reversal up. There was a two-week sell climax and then a sharp reversal up this week. But this week was a buy climax and therefore there is a 50% chance of a test back down within a couple weeks.
Trading Room
Traders can see the end of the day bar-by-bar price action report by signing up for free at BrooksPriceAction.com. I talk about the detailed E-mini price action real-time throughout the day in the BrooksPriceAction.com trading room. We offer a two-day free trial.


