
Despite a wave of fundamentals news involving the US-China trade war and deficit, markets are reacting to sentiment as measured by a technical view, writes Avi Gilburt.
I am amazed at how the market follows the market sentiment patterns and how news seems to fit in within those patterns.
This past week, as we were expecting a market top, Fed Chair Powel and President Trump provided the catalysts for the decline for which the market was setting up. For those who believe that the tariff news was the “cause” of the decline, I remind you that the same tariff war escalation seemed to have “caused” a 9% rally in 2018.
If the market drops when we enter further tariff escalation, the market is making sense. But, does that really mean that the tariffs are the true catalyst of the drop? If a trade war action is truly a cause, why did we rally 9% in 2018 with the same catalyst?
Moreover, the latest tariffs represented about $75 billion of costs which many viewed as a catalyst for the declines. Yet, when the Congressional Budget Office announced last Wednesday that the budget deficit has increased to $1 trillion dollars (more than 13 times the cost of the tariffs), the market rallied more than 40 points that same day.
Does this make you scratch your head? It should if you believe the market is driven by these day to day fundamentals.
Consider this: When the market is in an uptrend, seemingly bad exogenous news will be ignored, or discounted, as the market continues on its way to complete its uptrend pattern. Yet, when the market has completed its pattern or is in a downtrend pattern, the seemingly bad news seems to be the cause of the negative reaction to negative news.
Perhaps when market sentiment is negative, it will find negative news, and, when market sentiment is positive, it will find positive news. It really is the simple. One need not perform logical gymnastics to understand markets.
I know this seems counterintuitive because it was so clear that the market was down on Friday due to the tariff news, but it was also clear that the market rallied 9% in 2018 on trade war escalation. It was also clear that the market ignored news with significantly larger negative implications on Wednesday. And, in order to maintain a superficial perspective of what moves markets, you have to ignore 2018 and Wednesday, and only focus on Friday.
What you should be focused upon is what truly moves markets: market sentiment. Elliott Wave analysis accurately tracks market sentiment. It allows you to tune out the noise and focus on what is really important – the status of the current trend. It allows you to know when exogenous events will be ignored and when it will seemingly drive the market.
In a paper entitled “Large Financial Crashes,” published in 1997 in Physica A., a publication of the European Physical Society, the authors present a nice summation for the overall herding phenomena within financial markets:
“Stock markets are fascinating structures with analogies to what is arguably the most complex dynamical system found in natural sciences, i.e., the human mind. Instead of the usual interpretation of the Efficient Market Hypothesis in which traders extract and incorporate consciously (by their action) all information contained in market prices, we propose that the market as a whole can exhibit an “emergent” behavior not shared by any of its constituents.”
And, as Ralph Nelson Elliott said 80 years ago:
“The causes of these cyclical changes seem clearly to have their origin in the immutable natural law that governs all things, including the various moods of human behavior. Causes, therefore, tend to become relatively unimportant in the long term progress of the cycle. … Current news and political developments are of only incidental importance, soon forgotten; their presumed influence on market trends is not as weighty as is commonly believed.”
So, where are we in the current trend?
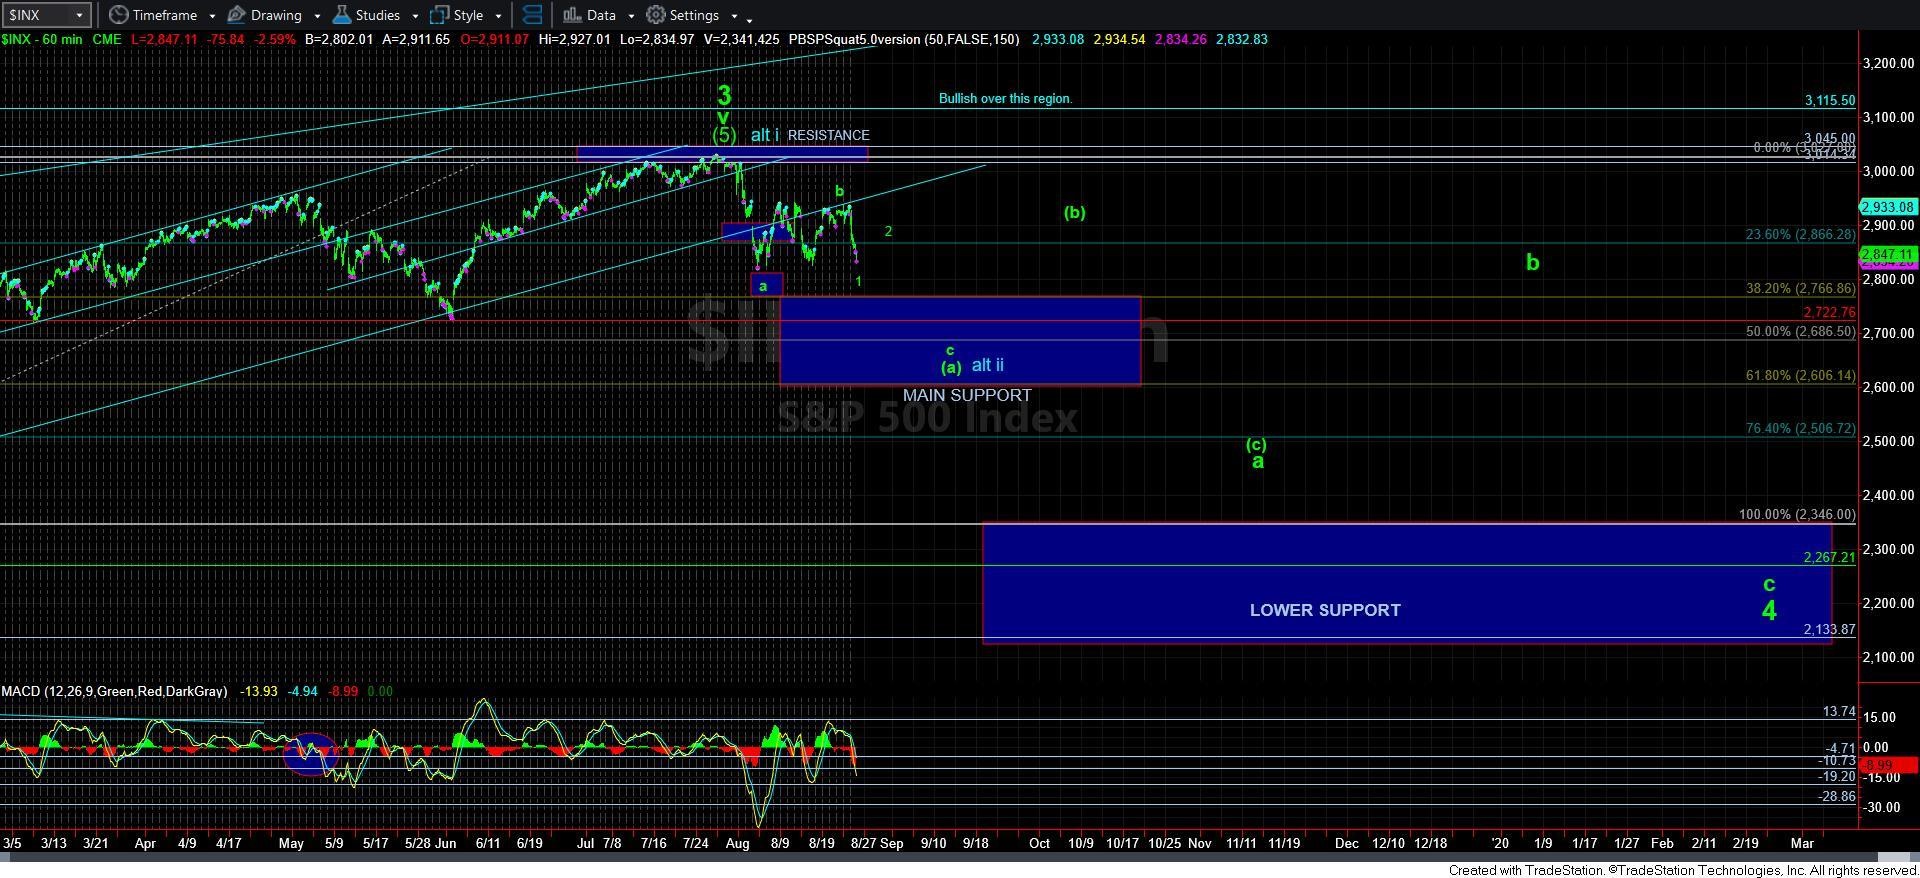
Well, it seems that the S&P 500 is now prepared to embark on its break down below 2700. While we will likely still see bounces, which will make people feel bullish again, as long as we remain below this past week’s high, pressure will remain to the downside. My next target region is going to be the 2600-2685 which I outlined over the last several weeks (see chart).
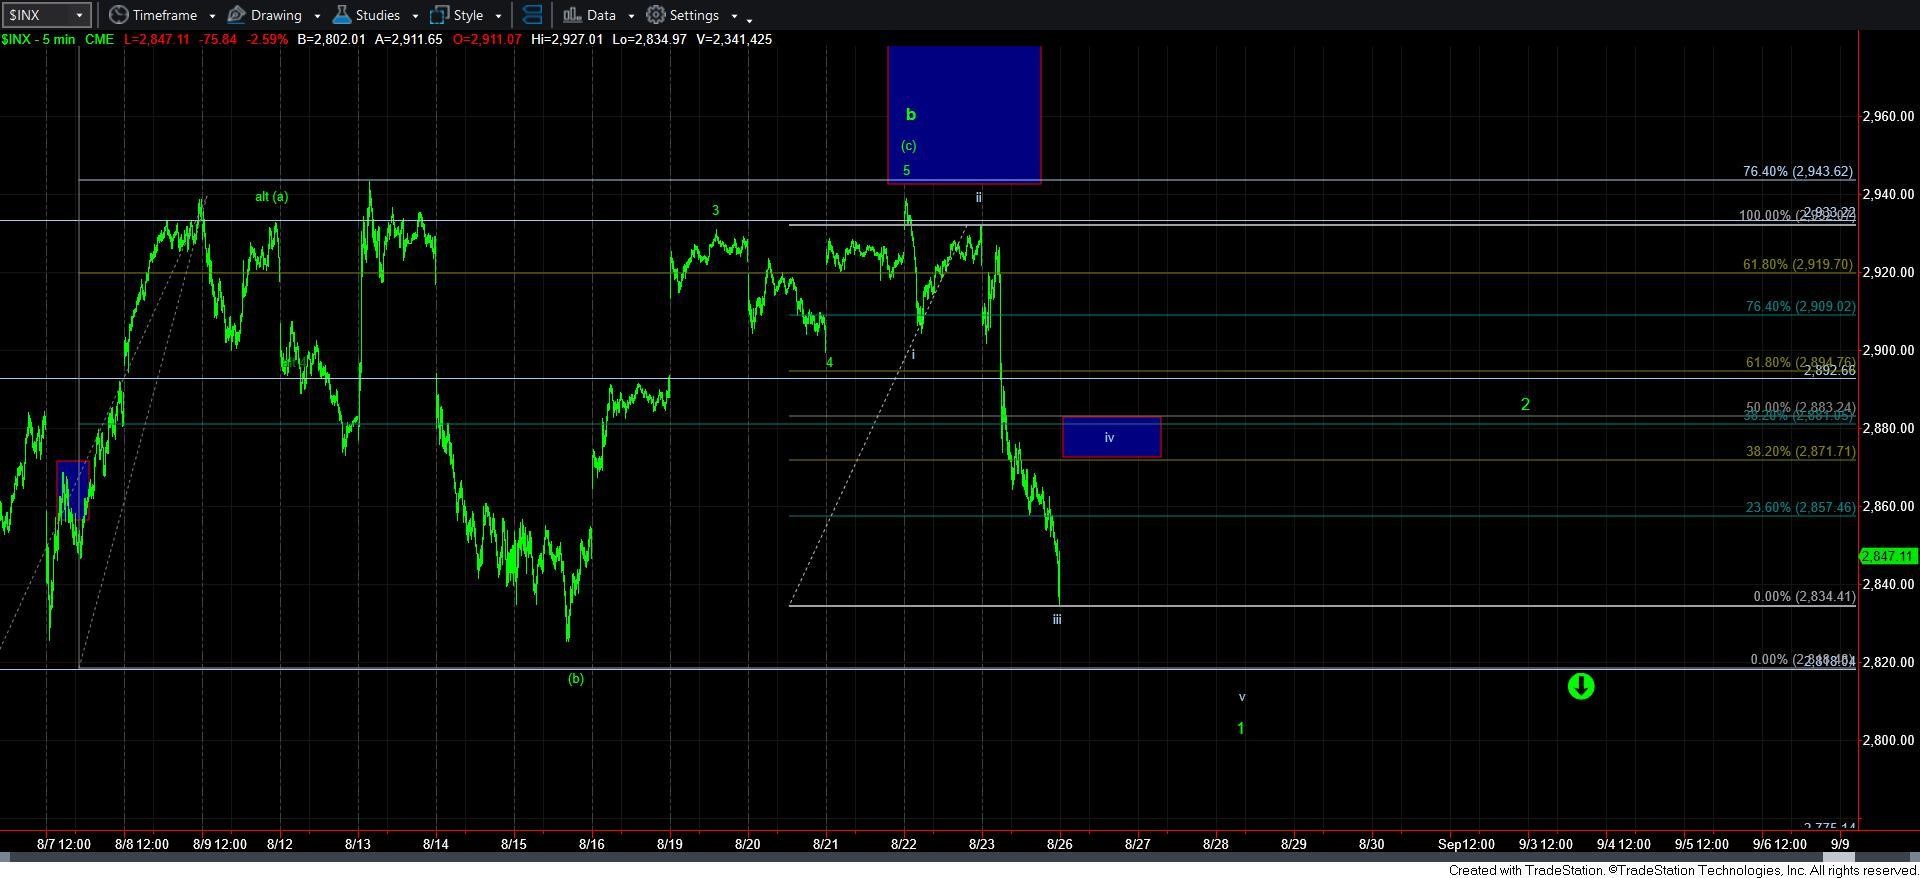
If you review the five-minute SPX chart, you will see set up points to a bottoming in wave 1 off this past week’s high (see chart). As long as we hold above 2800, expect a corrective bounce for a wave 2 before the market is ripe for its next decline, which can shave off 100 points to the downside in a very rapid move. To see a 3%+ down day during that 3rd wave down would not surprise me at all.
So, sentiment is no ripe for a break down. But, does this mean it will happen? No. How can anyone be 100% certain of the future? Rather, we view the market from a probabilistic perspective, and it suggests that there is a high likelihood that the market is going to break down in the coming weeks. Will some news event come along to attribute it to? Yes, as it almost always happens that way. But the market sentiment is now ripe for such bad news.
Avi Gilburt is a widely followed Elliott Wave analyst and founder of ElliottWaveTrader.net, a live trading room featuring his analysis on the S&P 500, precious metals, oil & USD, plus a team of analysts covering a range of other markets. He recently founded FATRADER.com, a live forum featuring some of the top fundamental analysts online today to showcase research and elevate discussion for traders & investors interested in fundamental rather than technical analysis.


