
Dangerous intraday volatility in the E-mini S&P increases chance of test of 2800, writes Al Brooks.
The E-mini S&P 500 has been sideways pattern for four months. Traders expect an eventual bull breakout because of the bull trends on the weekly and monthly charts.
The October candle on the monthly E-mini S&P 500 is a small bear doji (see chart below). With the strong reversal up over the past two weeks, this month might go above last month’s high. October would then be an outside up month, which would increase the chance of higher prices in November.
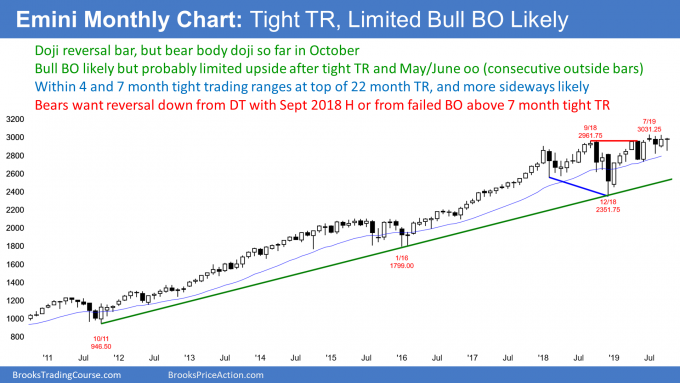
But the E-mini is at the top of its 22-month trading range. It has been in a tight trading range for seven months. That range has been particularly tight for four months. This is a Breakout Mode pattern. Since these nested trading ranges are within a 10-year bull trend, the odds eventually favor slightly higher prices.
Will the bull breakout reach a 700-point measured move up based on the height of the 22-month range? Probably not. Ten years is more than 100 bars and that is a long time for a strong bull trend. When there is a trading range late in a bull trend, it typically becomes the Final Bull Flag. That means the bull breakout usually fails after five to 10 bars (here, months), and then the E-mini returns to the trading range. Traders would then expect the selloff to test the bottom of the range. A Final Bull Flag reversal has a 40% chance of leading to a bear trend and not just a test of the bottom of the bull flag.
The 22-month trading range is also an Expanding Triangle top. But there is no good sell signal bar nor strong reversal down yet. Consequently, traders correctly continue to expect a new high within a few months.
Weekly Small Bull Bars
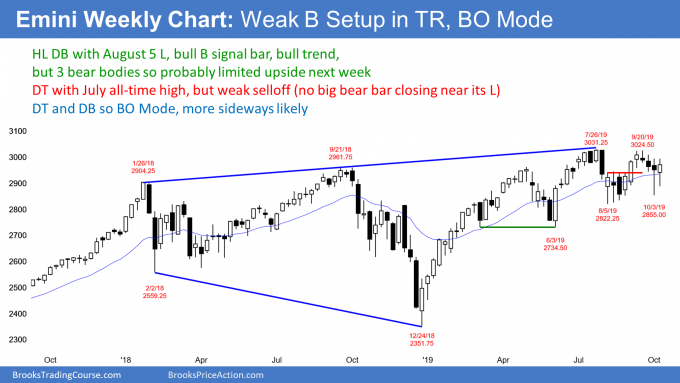
The E-mini futures is in the middle of four-month trading range on the weekly chart. September formed a lower high double top with July. Last week’s low is a higher low double bottom with the early August low.
When there is both a double bottom and a double top in a trading range, the chart is in Breakout Mode. Traders typically expect that the chance of a bear breakout to be about the same as for a bull breakout.
Here, there have been higher lows all year and no lower lows. Also, there have been conspicuous tails below the bars over the past month. Traders are buying selloffs. These factors make a bull breakout more likely.
While last week was a bull candlestick, it followed three consecutive bear bars. That reduces the chance that last week’s rally will continue straight up to a new high. But if next week is also a bull bar closing on its high, the bulls will probably get their new high by the end of the month.
Daily Breakout
The E-mini S&P futures on Friday broke above the four-week bear channel on its daily chart (see chart below). But the close near the low and the double top with last week’s sell climax high reduce the chance of an immediate breakout to a new high. This is trading range price action and it makes some sideways trading likely this week.
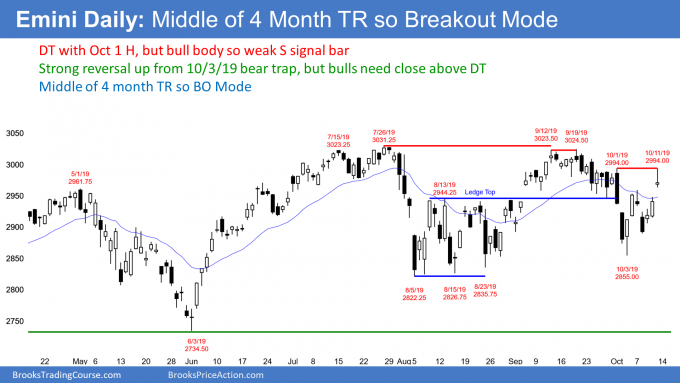
There have been several reversals over the past two weeks. The E-mini has been back in the August trading range for the past two weeks. In August, there were dramatic reversals for almost the entire month. Ultimately, the bulls got a breakout above that range.
On Friday, the bulls again broke above that August trading range. If the bulls get more bull trend bars this week, the breakout will be successful. They will try for a new all-time high.
Since June, I have been saying that the bulls would probably get their new high in September or October. They are now trying again.
However, the E-mini is still in a four-month trading range between 2800 and 3000. Until there is a breakout, there is no breakout. The bull trend on the higher time frames helps the bulls. Also, the strong reversal up from the bear trap last week helps as well.
But the lower high in September is good for the bears. So is the expanding triangle top on the weekly chart. They will try to stop this rally around the September lower high just above 3000.
If the bulls get several bull bars closing near their highs this week, the rally will probably continue up to a new high. If instead the bull bars have prominent tails or there are two or more bear bars, the E-mini will probably stay sideways for at least another week.
What about China?
I trade based on chart patterns and not news. However, sometimes the news can overwhelm the patterns and create a surprisingly strong breakout, up or down. If the news hits at a key pivot area, it can
The market has been waiting a long time for a trade deal with China. A partial agreement might come over the weekend. That could lead to a big gap up or down next week.
No one knows how much has already been priced into the market. It is also impossible to know if the market will see a deal as bullish or bearish. Finally, the initial reaction could be wrong. A big gap up or down could quickly reverse.
Traders have to be ready for anything, and they should trade in the direction of strength. Do not waste time trying to analyze the news. Just trade what the charts are doing. They show the consensus opinion of the institutions. Your opinion or the opinion of some TV scholar is irrelevant.
Extreme intraday volatility increases chance of big move
Anyone watching the E-mini intraday last week was struck by several unusually big, fast moves. The five-minute chart below shows two examples from Friday. The two inserts are one-minute charts that show what took place during the two five-minute bars highlighted.
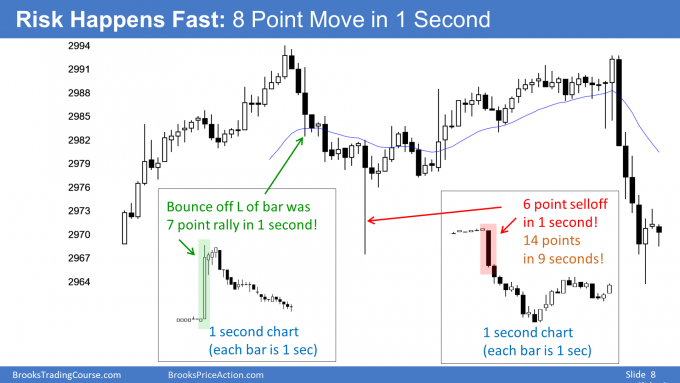
It is extremely unusual for the E-mini to move five or more points in one second. Yet, this happened many times last week.
What does it mean? First, it means some firms quickly made a lot of money and others lost. The losing firms will change their algorithms to prevent this from continuing to happen. That will prevent more of these moves near-term.
However, surprises breed other surprises. Each of the huge moves this week reversed. Traders therefore expect future ones to reverse as well.
Whenever something is obviously likely, it is not as likely as it appears. What would happen if the five-point selloff in one second was followed by another; and then another? We could see a Flash Crash, like on May 6, 2010. The E-mini fell almost 9% in 23 minutes. That would be about 250 points today.
While the odds are against it, traders should not dismiss something unusual as an irrelevant outlier. Everything matters, and the market might be telling us to expect something big in the next few weeks.
Trading Room
Traders can see the end of the day bar-by-bar price action report by signing up for free at BrooksPriceAction.com. I talk about the detailed E-mini price action real-time throughout the day in the BrooksPriceAction.com trading room. We offer a two-day free trial.


