
Canadian dollar appears to be hitting a wall of resistance based on commercial trade activity, writes Andy Waldock.
The Commercial traders are predicting that the Canadian dollar (CAD) is about to hit a wall of resistance. The Canadian dollar’s recent rally has brought both the downward sloping trend line dating back to the 2013 high as well as the 90- and 120-week moving averages into play between at .7660 and .7760.
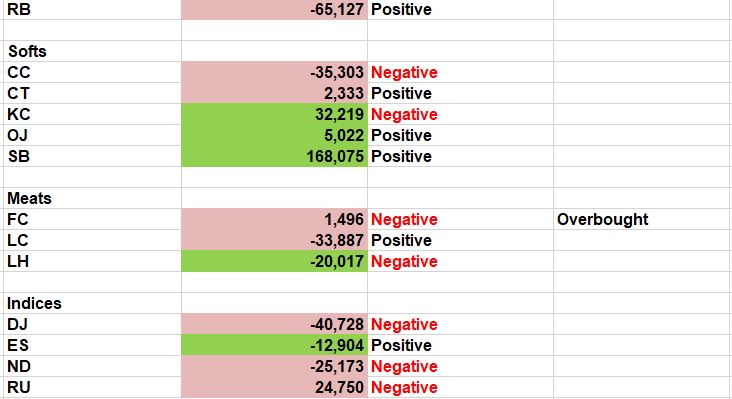
The commercial traders’ response has been significant and swift. The net commercial short position grew by more than 40k contracts over the last three weeks. Furthermore, the total commercial position has grown by 50k contracts over the same period. This means the commercial traders have been taking new short positions at a 4:1 clip over the last three weeks. This has also pushed their net short position to a new 52-week low (see COT Table below).
Additionally, the commercial selling against technical resistance comes just as we’re preparing a new Canadian dollar short sale for our seasonal subscribers. This swing trading setup creates a textbook commodity trade combining technical, fundamental (via the COT report), and seasonal factors into a single commodity trading strategy.
December soybean oil is also displaying a similar setup. Processors have been increasingly aggressive in hedging their anticipated production over the last few weeks. The increase in their net short position by more than 40k contracts has triggered our anxious indicator, which tells us that their current actions are quantifiably different than what we’d typically expect. Finally, processor selling has now reached a new 52-week low watermark, surpassing February’s sales.
Look for resistance in December soybean oil with the 120-week moving average coming in at 32.23, and commercial selling intensifying.
Interest Rates
Shifting gears to the interest rate sector, we’ll review our comments on the five-year Treasury note from last week, “If the December five-year T-note close below 118-23 this coming week, it will set off a run lower in prices and higher in yields as the market resets itself.” We all know the market never makes it easy. The December five-year T-note closed at 118-22.7, one tick below the trendline I mentioned last week. We’ll wait another week for a definitive answer.
The last setup we want to preview is in March sugar. We made a little money on the seasonal long position we recently offset, and also sent our seasonal subscribers the road map for the sugar price action we expect through December. Now, adding the week’s commercial traders’ actions into the equation, we can see the new, short trade shaping up nicely. Seasonally, the sugar market tends to fall from November through mid-December. Last week, commercial purchases were the only force supporting the sugar market as processors make one last pre-holiday purchase boom. This has spiked their net position to a net long record, just ahead of expected seasonal weakness. Some of this has to do with the broader pricing structure. Sugar is the cheapest it has been in nearly a decade.
We’ll use this rally to set up a short position in the next week or so. Stay tuned.
Position Updates
The December live cattle continue to rocket higher. The live cattle have made higher lows for six straight weeks. The protective sell stop for this long position should be raised to 113.00 to lock in more than $5k in open position profits.
Lastly, raise the December Euro currency protective sell stop to 110.37.
Here is what Andy had to say about seasonality and the COT Report at the TradersEXPO New York. Visit Andy Waldock Trading to learn more. Register and see our daily and weekly signals archive for entries and stop loss levels sent to our subscribers.


