
The stock market performance over the last three year could bode well for President Trump's reelection odds, notes Rocky White.
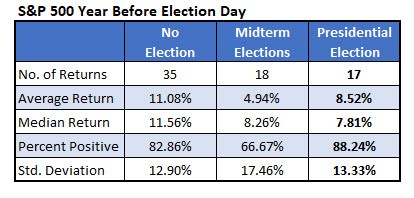
We're less than a year away from the 2020 U.S. presidential election, so I decided to look at whether there's been anything significant about how stocks behaved in the year before elections. The table below summarizes the S&P 500 returns in the 252 trading days before Election Day each year since 1950 (Election Day is the Tuesday of each year that falls between the 2nd and 8th of November).
Historically, it has been a bullish period averaging a gain of 8.5% and consistently positive returns. Specifically, 15 of the 17 returns have been positive. Stocks have had a higher average return during non-election years, but the percent positive was slightly lower. The years heading into midterm elections have been bearish compared to other years.
It seems intuitive to expect more volatility heading into presidential elections compared to other years, but the data shows that's not the case. Using the standard deviation of returns, the volatility is comparable to non-election years and it's significantly lower than in the year leading into the midterms.
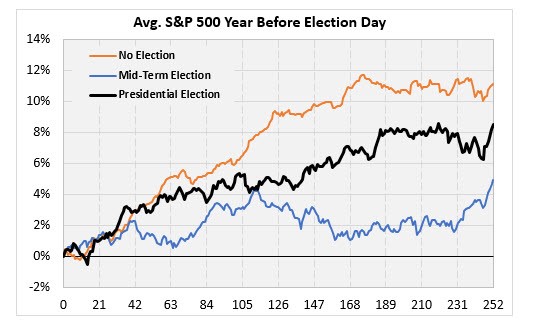
STOCK PATH IN ELECTION STUDIES
The chart shows the typical chart path of the S&P 500 Index (SPX) in the 252 trading days leading into Election Day. Using this as a guide, expect stocks to generally rise over the next 12 months with flat returns from the end of March through mid-May (days 105 to 140). Then there's a prolonged slump from the beginning of August right up until about a week before the election, at which point stocks rally. This is, of course, if you expect this election cycle to be like past election cycles.
HOW STOCK MARKETS AFFECT ELECTIONS
Above, we looked at how elections affected the markets. Let's see if markets affect elections. Naturally, you would expect bullish market returns to help incumbent candidates. Let's see if the numbers bear this out.
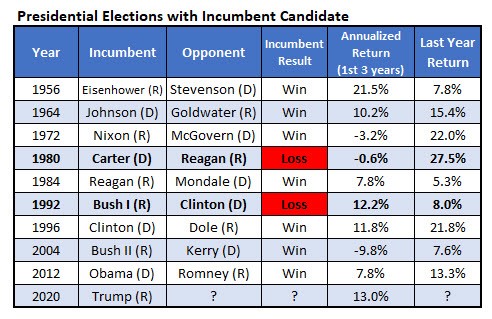
The table below shows presidential elections since 1950 in which an incumbent candidate was running. I also show the annualized return of the S&P 500 Index over the first three years of the administration and then the year leading into the election. My theory was that the first three years would have the biggest impact on whether the incumbent wins because the return in the final year might be influenced by expectations of the incumbent winning or losing. I could also see someone thinking the last year would be more relevant because voters tend to have short memories. The numbers are all there so you can come to your own conclusions.
Overall, incumbents won seven of nine contests. There were three times that the return in the first three years of their administration was negative. Carter lost to Reagan in 1980, as you would expect in a dismal market. In the other two occasions, however, the incumbent won. George Bush Jr. beat Sen. John Kerry in 2004, but one could argue that we were just a few years into the Middle East wars in 2004, so the stock market return wasn't the main factor that election. Then President Nixon defeated McGovern in 1972.
Since Trump was elected in 2016, the S&P 500 has returned a solid 13% on an annualized basis. When the index is up double-digits annualized in their first three years, incumbents have won three out of four elections.
Sign up here for the Schaeffer’s Research Edge weekly newsletter


