
This week is critical technically for the S&P 500 as traders will decide between the recent rebound or January’s sell-off, reports Al Brooks.
The E-mini S&P 500 has rallied strongly for two weeks, but the rally might be a bull leg in the January trading range. However, there is currently only a 30% chance that February will reverse back down to the low of the month in the final two weeks.
The E-mini S&P 500 futures formed a bear reversal bar in January on its monthly chart (see below). However, instead of triggering the monthly sell signal by going below the January low, the February E-mini monthly bar rallied above the January high.
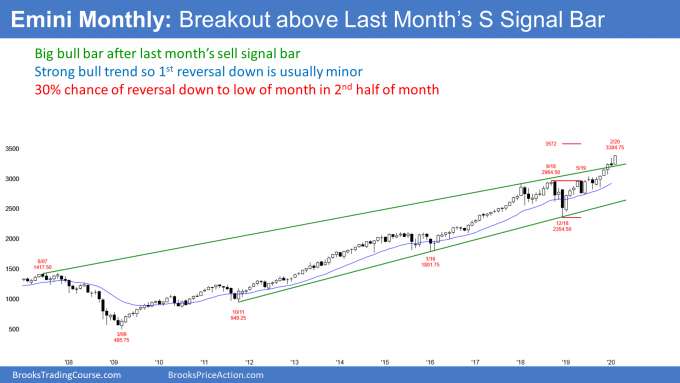
If February closes above the January high, February would then be a bull breakout bar. That would make higher prices likely in March. If March is up, April would probably be sideways to up as well. This is because March and April are historically the most bullish consecutive months of the year.
Can February reverse down?
There is always a bear case. When there is a bear reversal bar, the next month also often has a big tail on top. If it does, there is then a micro double top, which is a sell signal.
For February to have a big tail on top, it has to rally and then sell off. It has rallied for the first half of the month. That tail on the top of the January candlestick increases the chance of a selloff in the second half of February.
So that is the fight we will see over the next two weeks. Will the bulls get February to close above the January high, increasing the chance of higher prices in March? Or, will the bears get a reversal back down to the February low, creating a micro double top? The bears have a 30% chance of getting a reversal back to the February low by the end of the month. That would increase the chance of lower prices in March.
Because the six-month bull trend is strong and the E-mini has been in a bull trend for 10 years, the odds continue to favor at least slightly higher prices. But traders know that February might sell off in the final two weeks.
The title of my Jan. 21 report was, “S&P 500 Correction Nearing,” where I suggested a 5% correction in the E-mini could begin in three weeks. The selloff began a few days later. The reason why I said there would be a pullback was because of the consecutive big bull bars on the weekly chart in mid-January (see chart below).
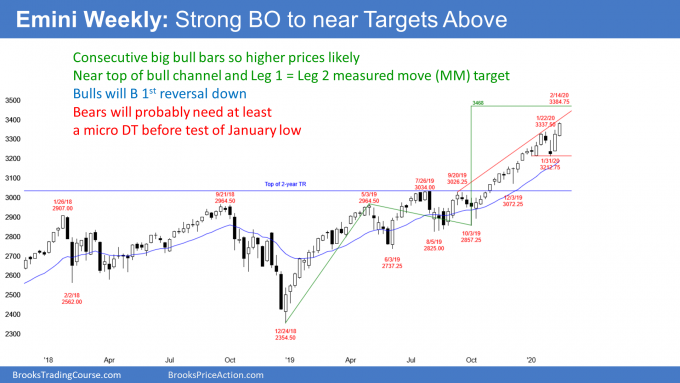
When there are consecutive big bull bars late in a bull trend, they attract profit-takers. The first target is the bottom of the two bull bars. The E-mini fell two ticks below that target but then resumed its rally. The selloff was a little more than 4%.
The weekly S&P 500 E-mini futures chart once again has a pair of consecutive big bull bars closing near their highs. However, the two week selloff relieved some of the buy climax. The bulls have a better chance of at least slightly higher prices.
Will the 2-week breakout succeed?
There is a bull trend channel line just above last week’s high. Also, there is a Leg 1 = Leg 2 measured move target above at 3468. Will the rally continue up to that target and the 3500 Big Round Number or will it test the January low?
The momentum up has been strong, but the E-mini has been above the 20-week exponential moving average for many bars. Also, the January 4% selloff is a sign that the bears can be strong. Consequently, it is currently more likely that this rally will stall within the next couple of weeks.
this week is important. Last week broke above the Jan. 22 high. If this week is also a bull bar, traders will expect higher prices over the next few weeks.
However, if the next weekly bar is bearish, especially a bear bar closing near its low, traders will think that the two-week breakout might fail. A bear bar would increase the chance of lower prices over the following week.
Friday was an inside day after an outside day on the daily E-mini futures chart (see below). This is therefore an inside-outside-inside (ioi) Breakout Mode pattern. Since Friday had a bull body and the trend is up, a bull breakout is more likely. Furthermore, the bull body makes this a weak sell setup.
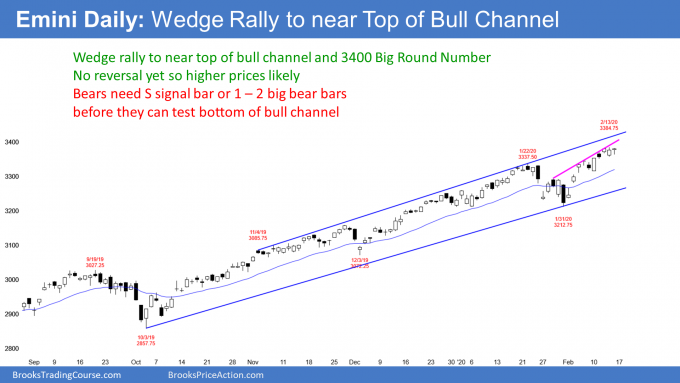
It is worth noting that the daily chart has had three pushes up that began with the Jan. 29 high. The rally is therefore a wedge, which often leads to a reversal down. Since the bull channel is tight, this is a minor sell setup. The best the bears can probably get this week is a two- t three-day pullback. Traders expect at least slightly higher prices.
The bulls hope that the rally up from the Jan. 31 low is another Small Pullback Bull Trend, like the four-month rally from the October low. There is room to the top of the five-month bull channel and that is a magnet above.
Also, the second leg up to the Feb. 6 high was strong enough to reset the count in the wedge rally. That could instead be a new first leg up. If so, traders hoping for a wedge top might get another brief leg up after a one- to two-day pullback from this week’s high (the new second leg up in the wedge).
There are often several ways to draw wedge tops. No one knows in advance what the consensus choice it. But traders are aware that the E-mini might get a wedge reversal down this week. A strong reversal down could continue down to the January low. If so, traders will conclude that the two-week rally was just a bull leg in a trading range that began around Christmas. More likely, the E-mini will be sideways to up again this week.
If there is a test of the January low in March and then a rally to a lower high, there would be a head and shoulders top. However, most head and shoulders tops do not lead to major trend reversals.
I know this is confusing. The important point is that traders are deciding if the two-week rally is a resumption of the four-month bull trend or just a bull leg in a trading range that began around Christmas.
There is no top yet. If the E-mini gets a couple closes above 3400, then the bull trend is probably resuming. Traders will then look at other targets above, like the Leg 1 = Leg 2 measured move target on the weekly chart at 3468.
However, if this week begins to reverse down, traders will suspect that the rally was just a bull leg in the two-month trading range. They will look for a bear leg and a test of the bottom of the range. That is the January low. Therefore, this week’s behavior will give traders information that will help them choose between these two alternatives.
Trading Room
Traders can see the end of the day bar-by-bar price action report by signing up for free at BrooksPriceAction.com. I talk about the detailed E-mini price action real-time throughout the day in the BrooksPriceAction.com trading room. We offer a two-day free trial.


