
Gold is rallying on the back of increased Coronavirus worries right into a bullish chart pattern, reports Suri Duddella.
Equity markets are in freefall as are most other risk/on assets after revelations this weekend that the Coronavirus has spread more broadly than previously thought. As risk/on assets have dropped defensive sectors, especially gold, which tends to thrive when the world is near panic conditions, have thrived.
Even before the events of the last few days, gold exchange traded funds (ETFs) and mining stocks had been exhibiting bullish chart patterns. Specifically, many gold products exhibited Cup & Handle patterns.
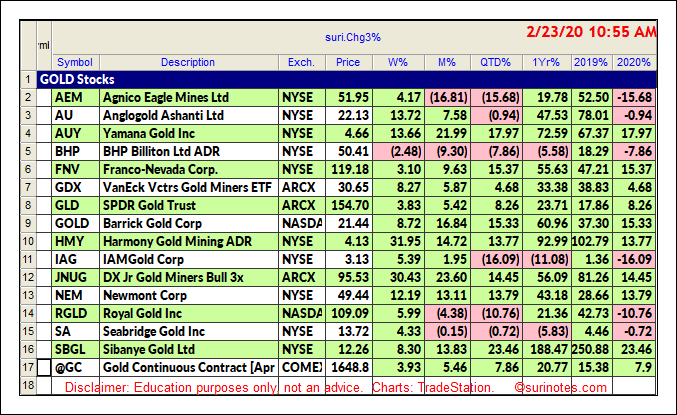
Below is a list of gold and gold mining related stocks and ETFs, with performance in 2019 and 2020.
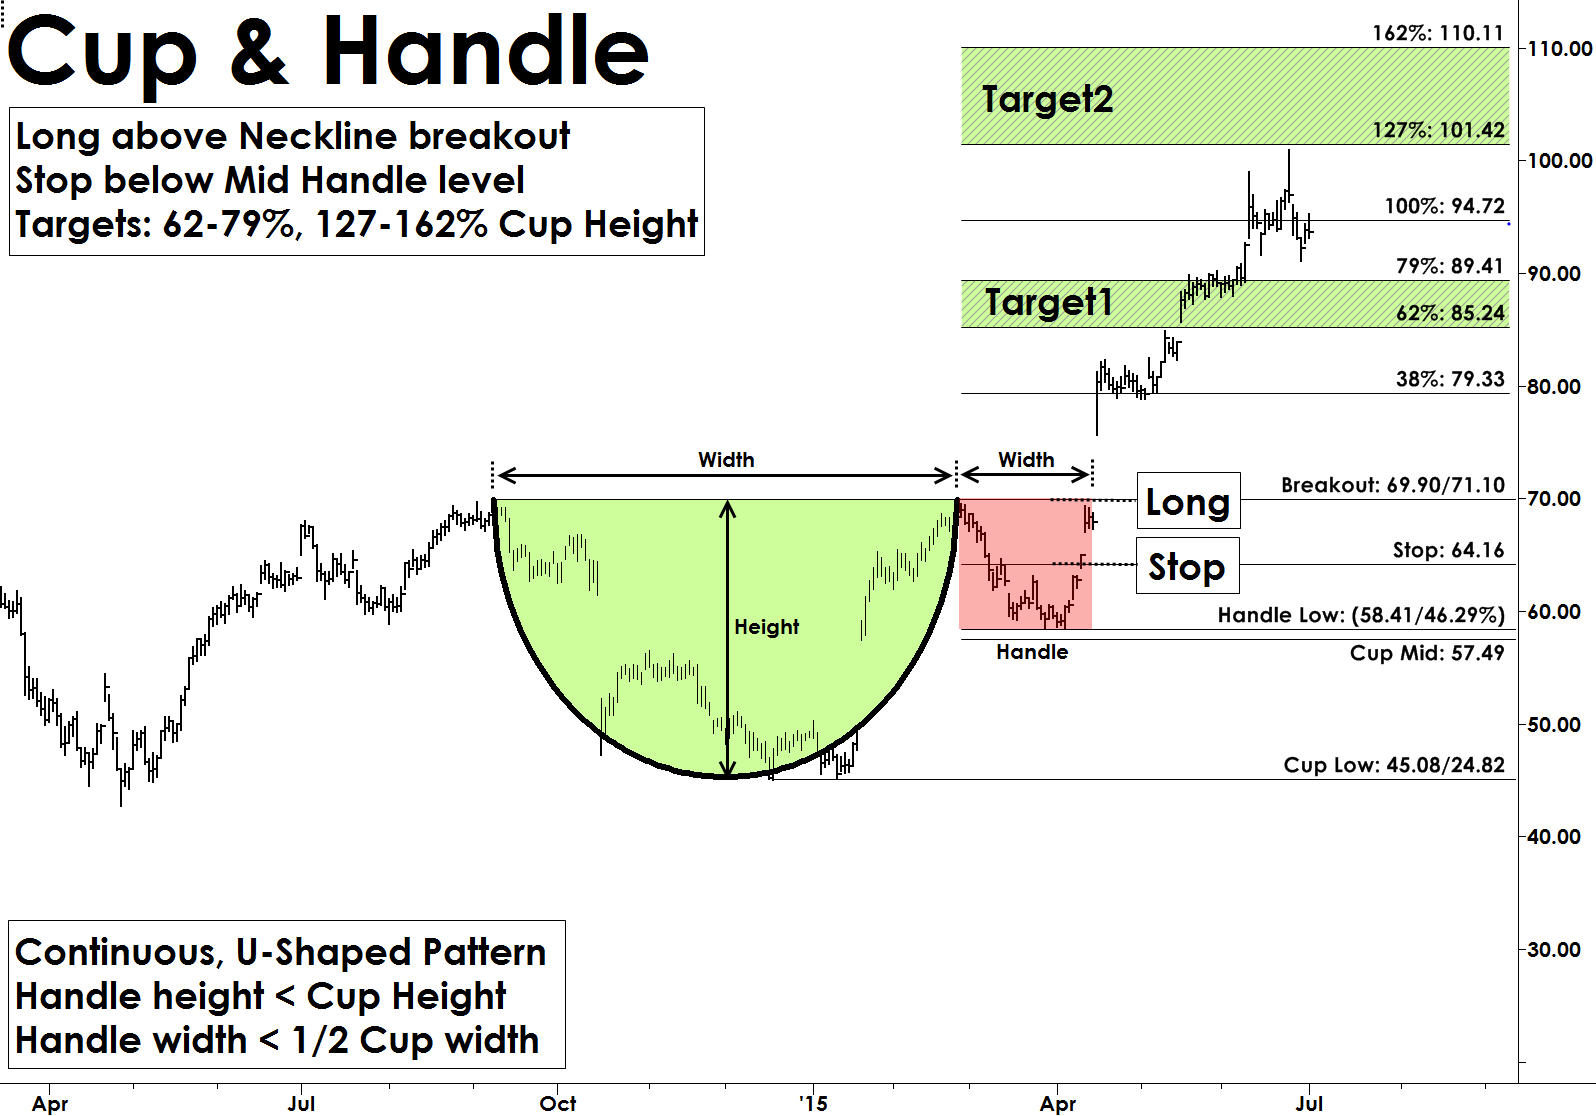
Cup & Handle Patterns
The Cup and Handle chart pattern was developed and popularized by William J. O’Neil in the 1980s through his CANSLIM methodology, published in Investors’ Business Daily newspaper and his book "How to Make Money in Stocks."
The Cup and Handle pattern resembles a Cup with a Handle, are continuation patterns that usually form in bullish trends. Most Cup and Handle patterns are very reliable and offer great trading opportunities. They also form in all markets and in all time-frames. The “Cup” formation is developed as consolidation phase during price rallies from the round bottom formation over multiple weeks to months. The “Handle” part forms due to a price correction after Cup formation and before a clear breakout to the upside.
Cup and Handle pattern structure show the momentum pause after reaching a new high in a U-Shape form, followed by another attempt to breakout. When this breakout from the rim of the cup fails it starts to fall back to build the "Handle" structure. Usually, the handle structures are small, and the handle depth should not exceed more than 50% of cup depth. This handle part of the pattern generates interest in buyers as they expect the pattern to breakout from these levels. The pattern is valid only if price convincingly breaks out with increased volume above the rim of the cup levels (see chart).
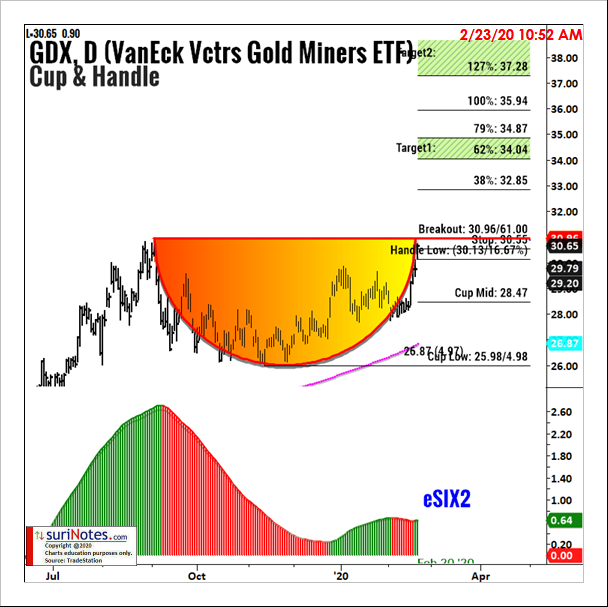
GDX Cup & Handle Pattern
The daily chart in the VanEck Vectors Gold Miners ETF (GDX) shows an emerging Cup and Handle pattern. GDX formed a Cup and Handle pattern from September 2019 to February 2020 and is trading near its breakout level of $31. Cup and Handle patterns are valid only when price closes above the breakout level. The GDX breakout level is $31; the cup-mid stop level is $28.5 and breakout targets are $34 and $37.25 (see chart).
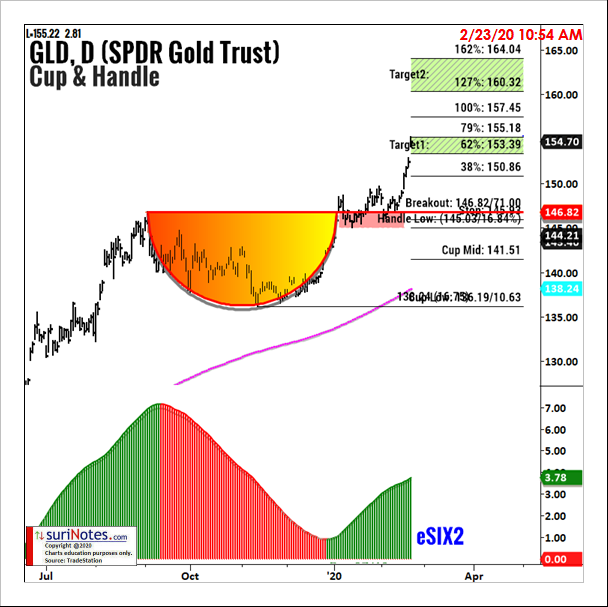
SPDR Gold ETF
The SPDR Gold ETF (GLD) has also formed a Cup and Handle pattern and its breakout (see chart below). GLD’s Cup and Handle formed from September 2019 to January 2020 and traded above breakout level of $147 to signal a long trade in January. The stop level was set at $141 and breakout targets are $153 and $160.
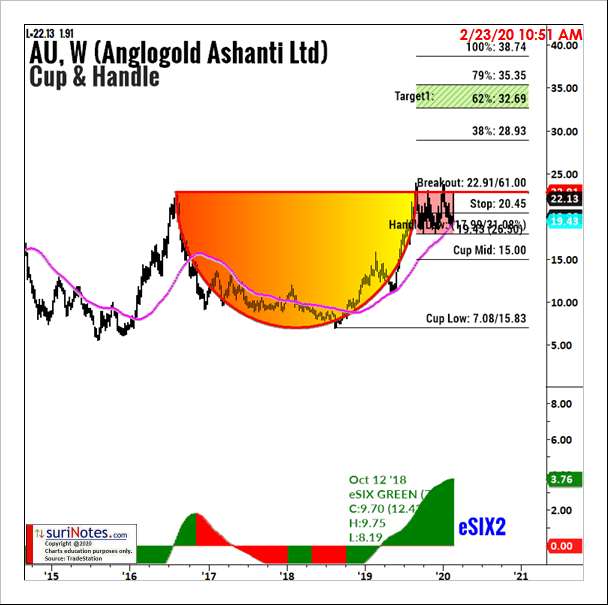
Anglogold Ashanti Ltd.
The AngloGold Ashanti Ltd. ETF (AU) of goldmining stocks formed a Cup and Handle pattern from March 2016 until October 2019. AU formed the handle between October 2019 until February 2020 and trading near its breakout level of $23. A close above $23 may signal a long entry with a stop placed below the handle low at $18 with profit targets of $32 and $38.
Find more of Suri’s work at surinotes.com.


