
It’s time to rotate out of higher volatility stock ETFs into safer assets, according to Joon Choi’s research. Read what ETFs investors should move to.
In my last article, I discussed how investors’ appetite for riskier stocks is waning based on extreme readings of the relative strength in the Invesco S&P 500 High Beta ETF (SPHB)/Invesco S&P 500 Low Volatility ETF (SPLV) spread. Since then the SPHB has fallen 5.8% while SPLV rose 0.4%.
To build on the insights gained from analyzing the SPHB/SPLV ratio I decided to research and discuss yet another relative strength indicator that is showing that additional risk may not be rewarded with higher return. This article will discuss the relationship between the VanEck Vectors Semiconductor ETF (SMH) and the Invesco QQQ Trust Series 1 ETF (QQQ) over the past few years and why investors may need to exercise caution.
Overview of SMH
SMH has 26 stock holdings with more than 63% in its top 10 holdings, making it one of the most concentrated ETFs. It is one of two ETFs that has bested the mighty QQQ since its inception in December 2011 (22.9% vs 20.8% annual return). The best performing ETF happens to be another semiconductor ETF, the iShares PHLX Semiconductor ETF (SOXX) up 24% in that period. The semiconductor sector is one of the most volatile investments and tends to lead the stock market overall.
SMH vs. QQQ
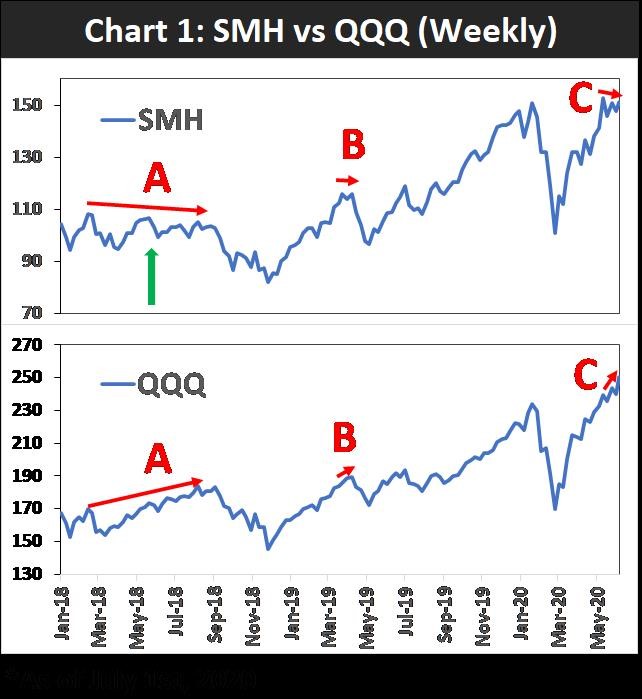
In recent weeks, SMH has plateaued but the QQQ is setting new record highs, leading to a negative divergence between the two ETFs (Point C in Chart below). A similar pattern formed in May 2019, which led to a three-week selloff of 11% for SMH and 8% for QQQ. In 2018 SMH was trending down during the first three quarters whereas QQQ was trending up for the same period. This also led to a negative divergence between the two ETFs which resulted in a 22% loss during the fourth quarter for both ETFs.
One might argue that the bearish formation formed in June 2018 (green arrow in chart) and that would be correct. However, SMH did not see higher prices after forming this divergence, so it would have been beneficial for an investor to sell SMH.
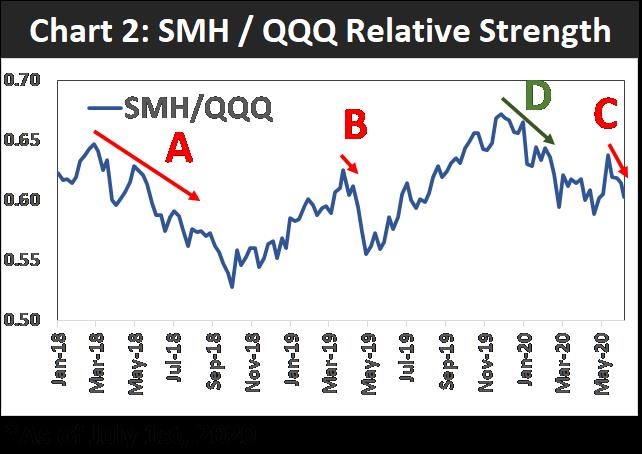
SMH/QQQ relative strength magnified SMH’s loss of strength during the three-period high-lighted below (Points A, B & C in Chart 2 below). Notice how much SMH was lagging QQQ prior to the 20% correction in the fourth quarter of 2018 (Point A). Relative Strength sharply deteriorated in Point B, very similar to the current underperformance (Point C). In addition, it is interesting to note that SMH was significantly underperforming QQQ (Point D) prior to entering the bear market (greater than 20% selloff) in March.
Conclusion
It appears in recent weeks that the equity market is not rewarding higher volatility stocks with additional return. The relative strength between SMH and QQQ seems to suggest that SMH may be entering a period of underperformance with respect to QQQ. Moreover, what concerns me is that the SMH/QQQ relative strength spread has not recovered to levels achieved at year end while QQQ is setting record highs.
This could be a warning of impending stock market weakness during the summer. My recommendation is to rotate out of higher volatility investments such as SPHB, SMH and the iShares Russell 2000 ETF (IWM) in favor of SPLV and the Consumer Staples Select Sector SPDR Fund (XLP). At the very least, you should consider selling some calls on your existing positions to collect some time premium.
Lastly, you could investigate shorting SMH or SOXX and buying QQQ to implement a long-short position that has an upside potential with significantly less risk.
Joon Choi is Senior. Portfolio Manager/Research Analyst at Signalert Asset Management. Sign up here for a free three-month subscription to Dr. Marvin Appel’s Systems and Forecasts newsletter, published every other week with hotline access to the most current commentary. No further obligation.


