
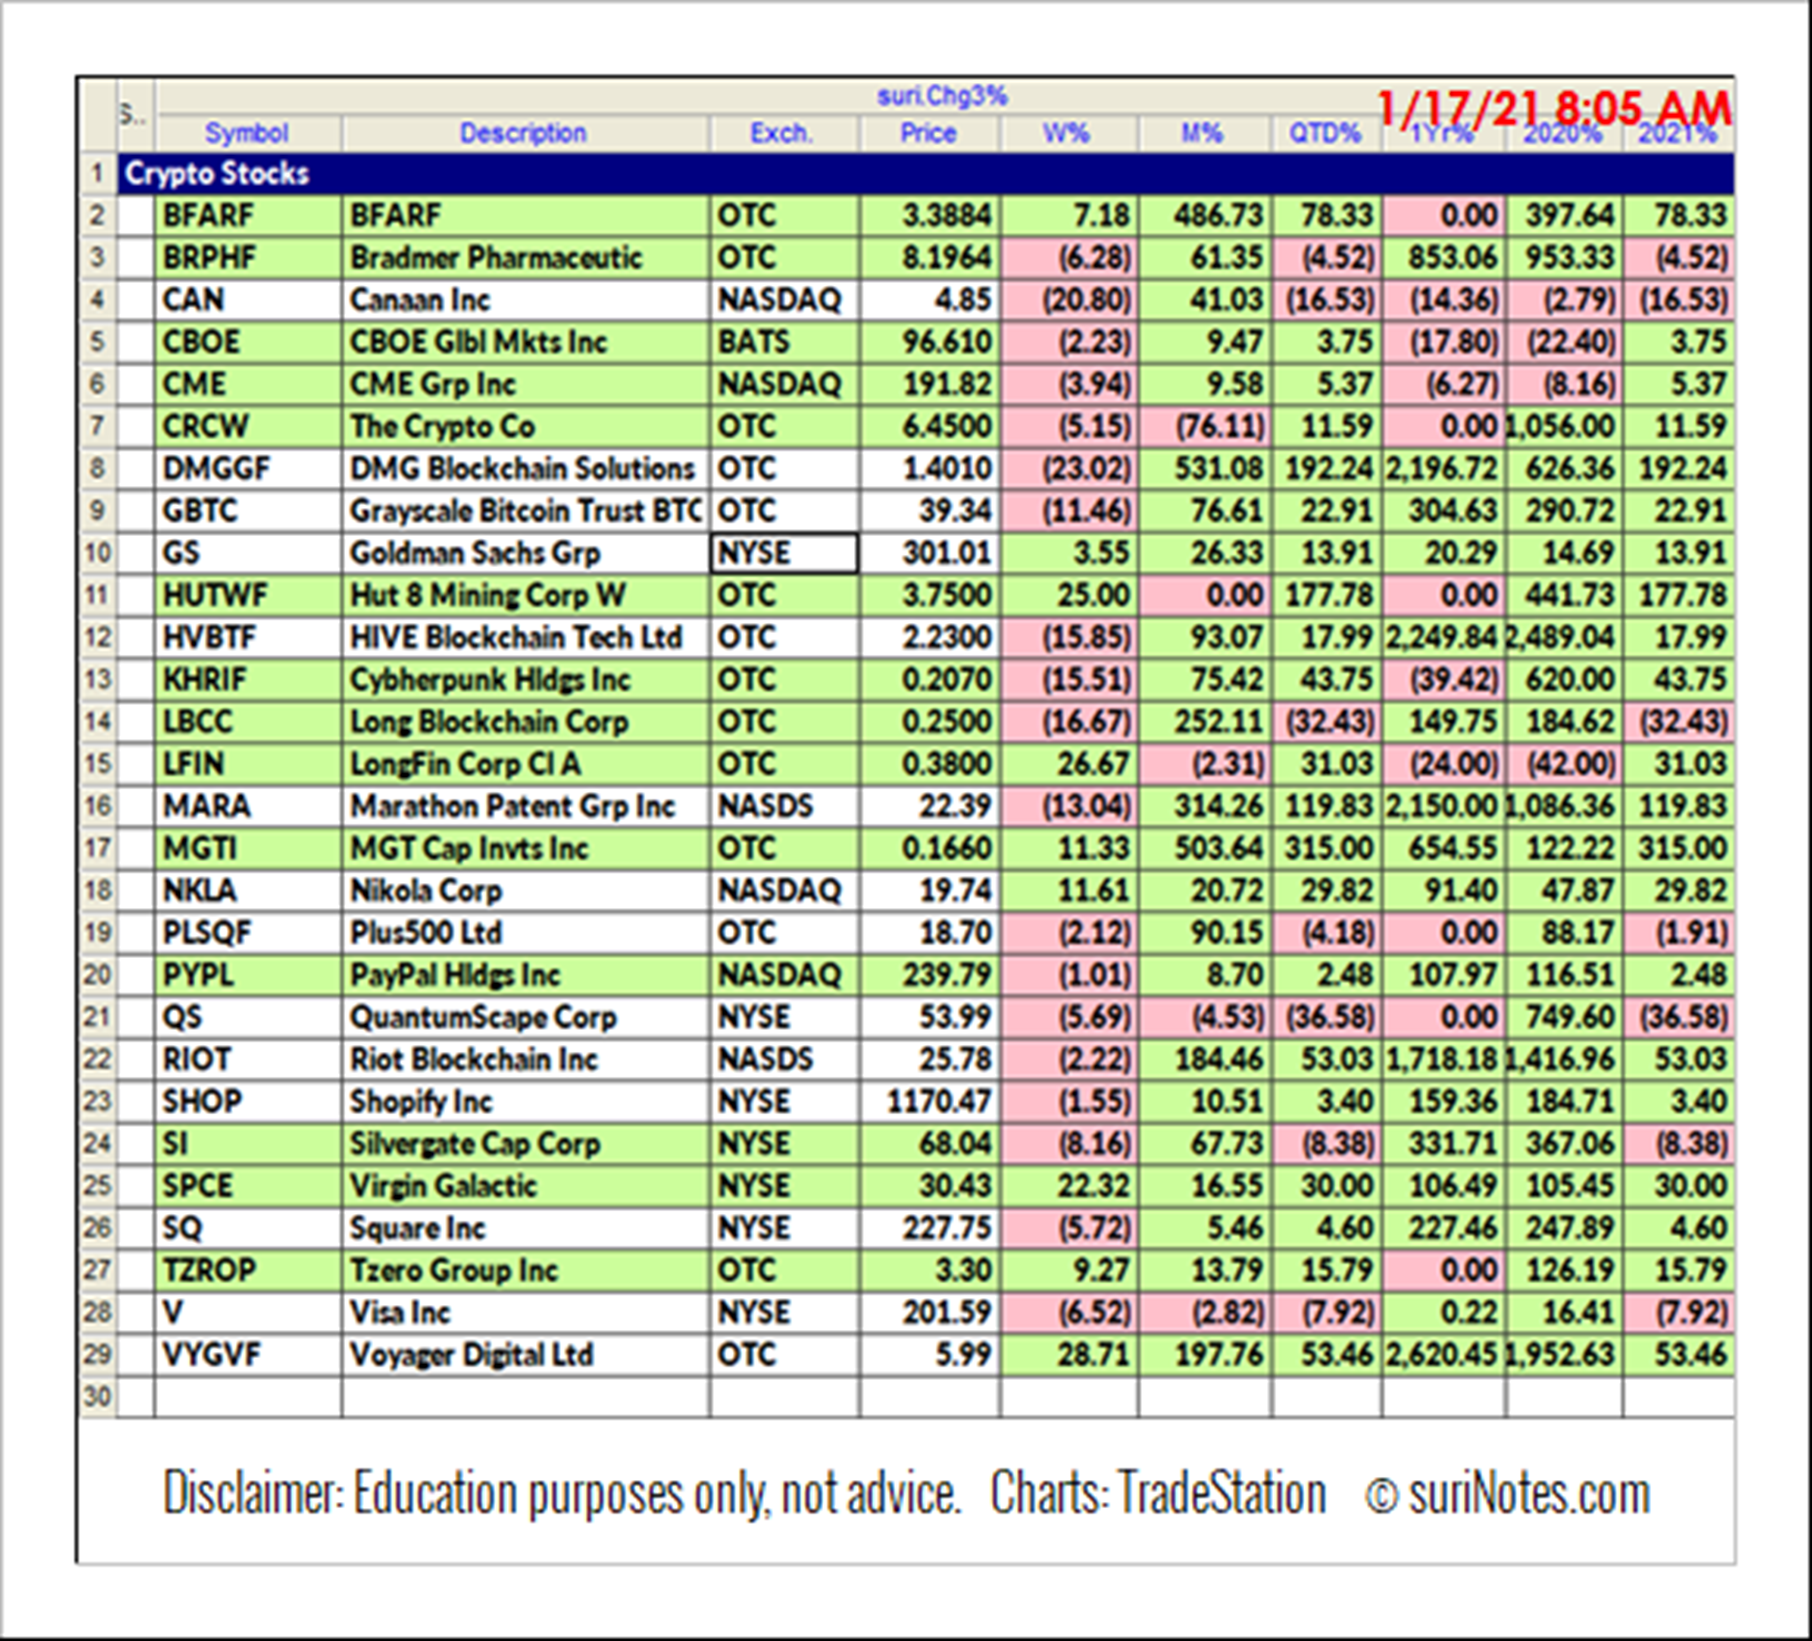
The surge of cryptocurrency and blockchain technologies has gained popularity in the investor world in 2020 and 2021. Many of these stocks have achieved triple-digit returns in 2020 and trading in parabolic arc patterns, states Suri Duddella of suriNotes.com.
Investors need to be aware that most parabolic arc rise patterns see significant retracements after the asymptotic parabolic extensions. Here is a list of blockchain and crypto stocks and their performances in 2020 and 2021.
Parabolic Arc Patterns
Parabolic arc chart patterns form when there is a steep rise in prices caused by irrational buying and intense speculation. Parabolic arc patterns are rare, but they are reliable and are generated in mega-bull trends. These patterns trend gradually making higher highs and lower lows in the beginning stages but can be volatile in the exhaustion and reversal stages. Irrational buying in the public generates a strong rally to push prices vertically, followed by a steep sell-off. Examples of these market types are the NASDAQ bullish markets during 1990-2000 (retraced 80%) and Gold prices from 2000-2011 (retraced 62%).
Parabolic arc is a reversal pattern and has a very predictable outcome. Although these patterns are predictable, they are relatively difficult to trade since the market sentiment is bullish and may be fairly tough to point reversals to trade. Most parabolic arc patterns have a significant correction of 62-79% of its price rise (from the top).
Once parabolic arc patterns reach their target of 62-79%, they tend to reverse as an oversold bounce. Usually these bounces are between 25-50% of its prior fall range from the peak.
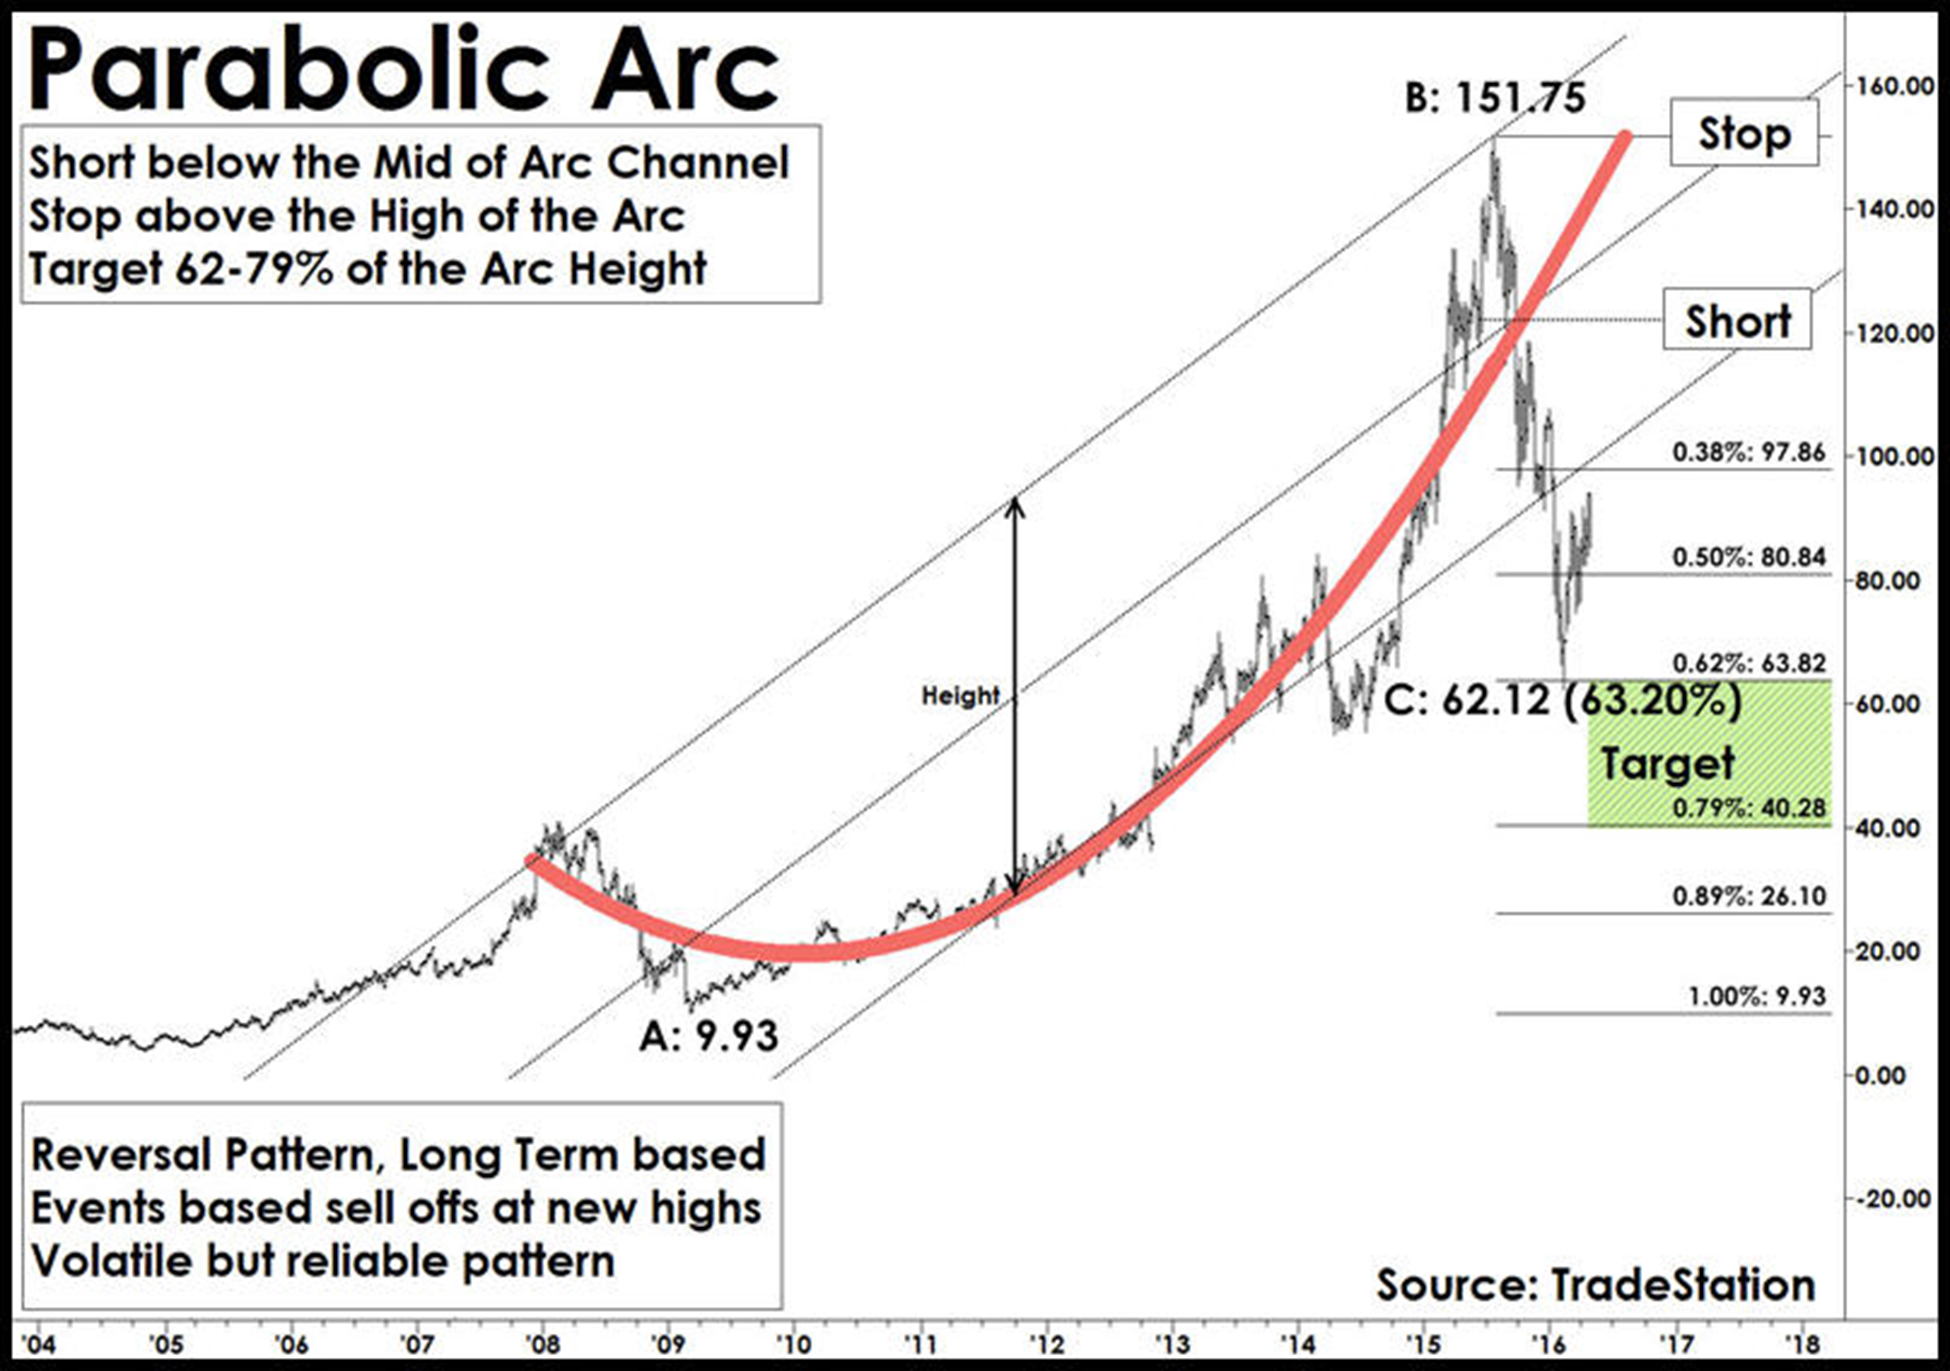
Trade: In parabolic arc patterns, prices move up vertically and eventually, the acceleration comes to a stop and then reverses. Prices start showing lower lows and may attempt to regain the top again. Draw a channel connecting the top and bottom of the pattern. Enter a “short” trade at the breakdown of the channel trend line connecting the pattern high and pattern lows.
Target: Measure the distance of the rise from the base to the top of the pattern. Most parabolic arc patterns return to the 62-79% of its rise. 50% is the first target.
Stop: Protect the trade by placing a few ticks above the high of the parabolic arc.
MoneyShow’s Top 100 Stocks for 2021
The top performing newsletter advisors and analyst are back, and they just released their best stock ideas for 2021. Subscribe to our free daily newsletter, Top Pros' Top Picks, and be among the first wave of investors to see our best stock ideas for the new year.
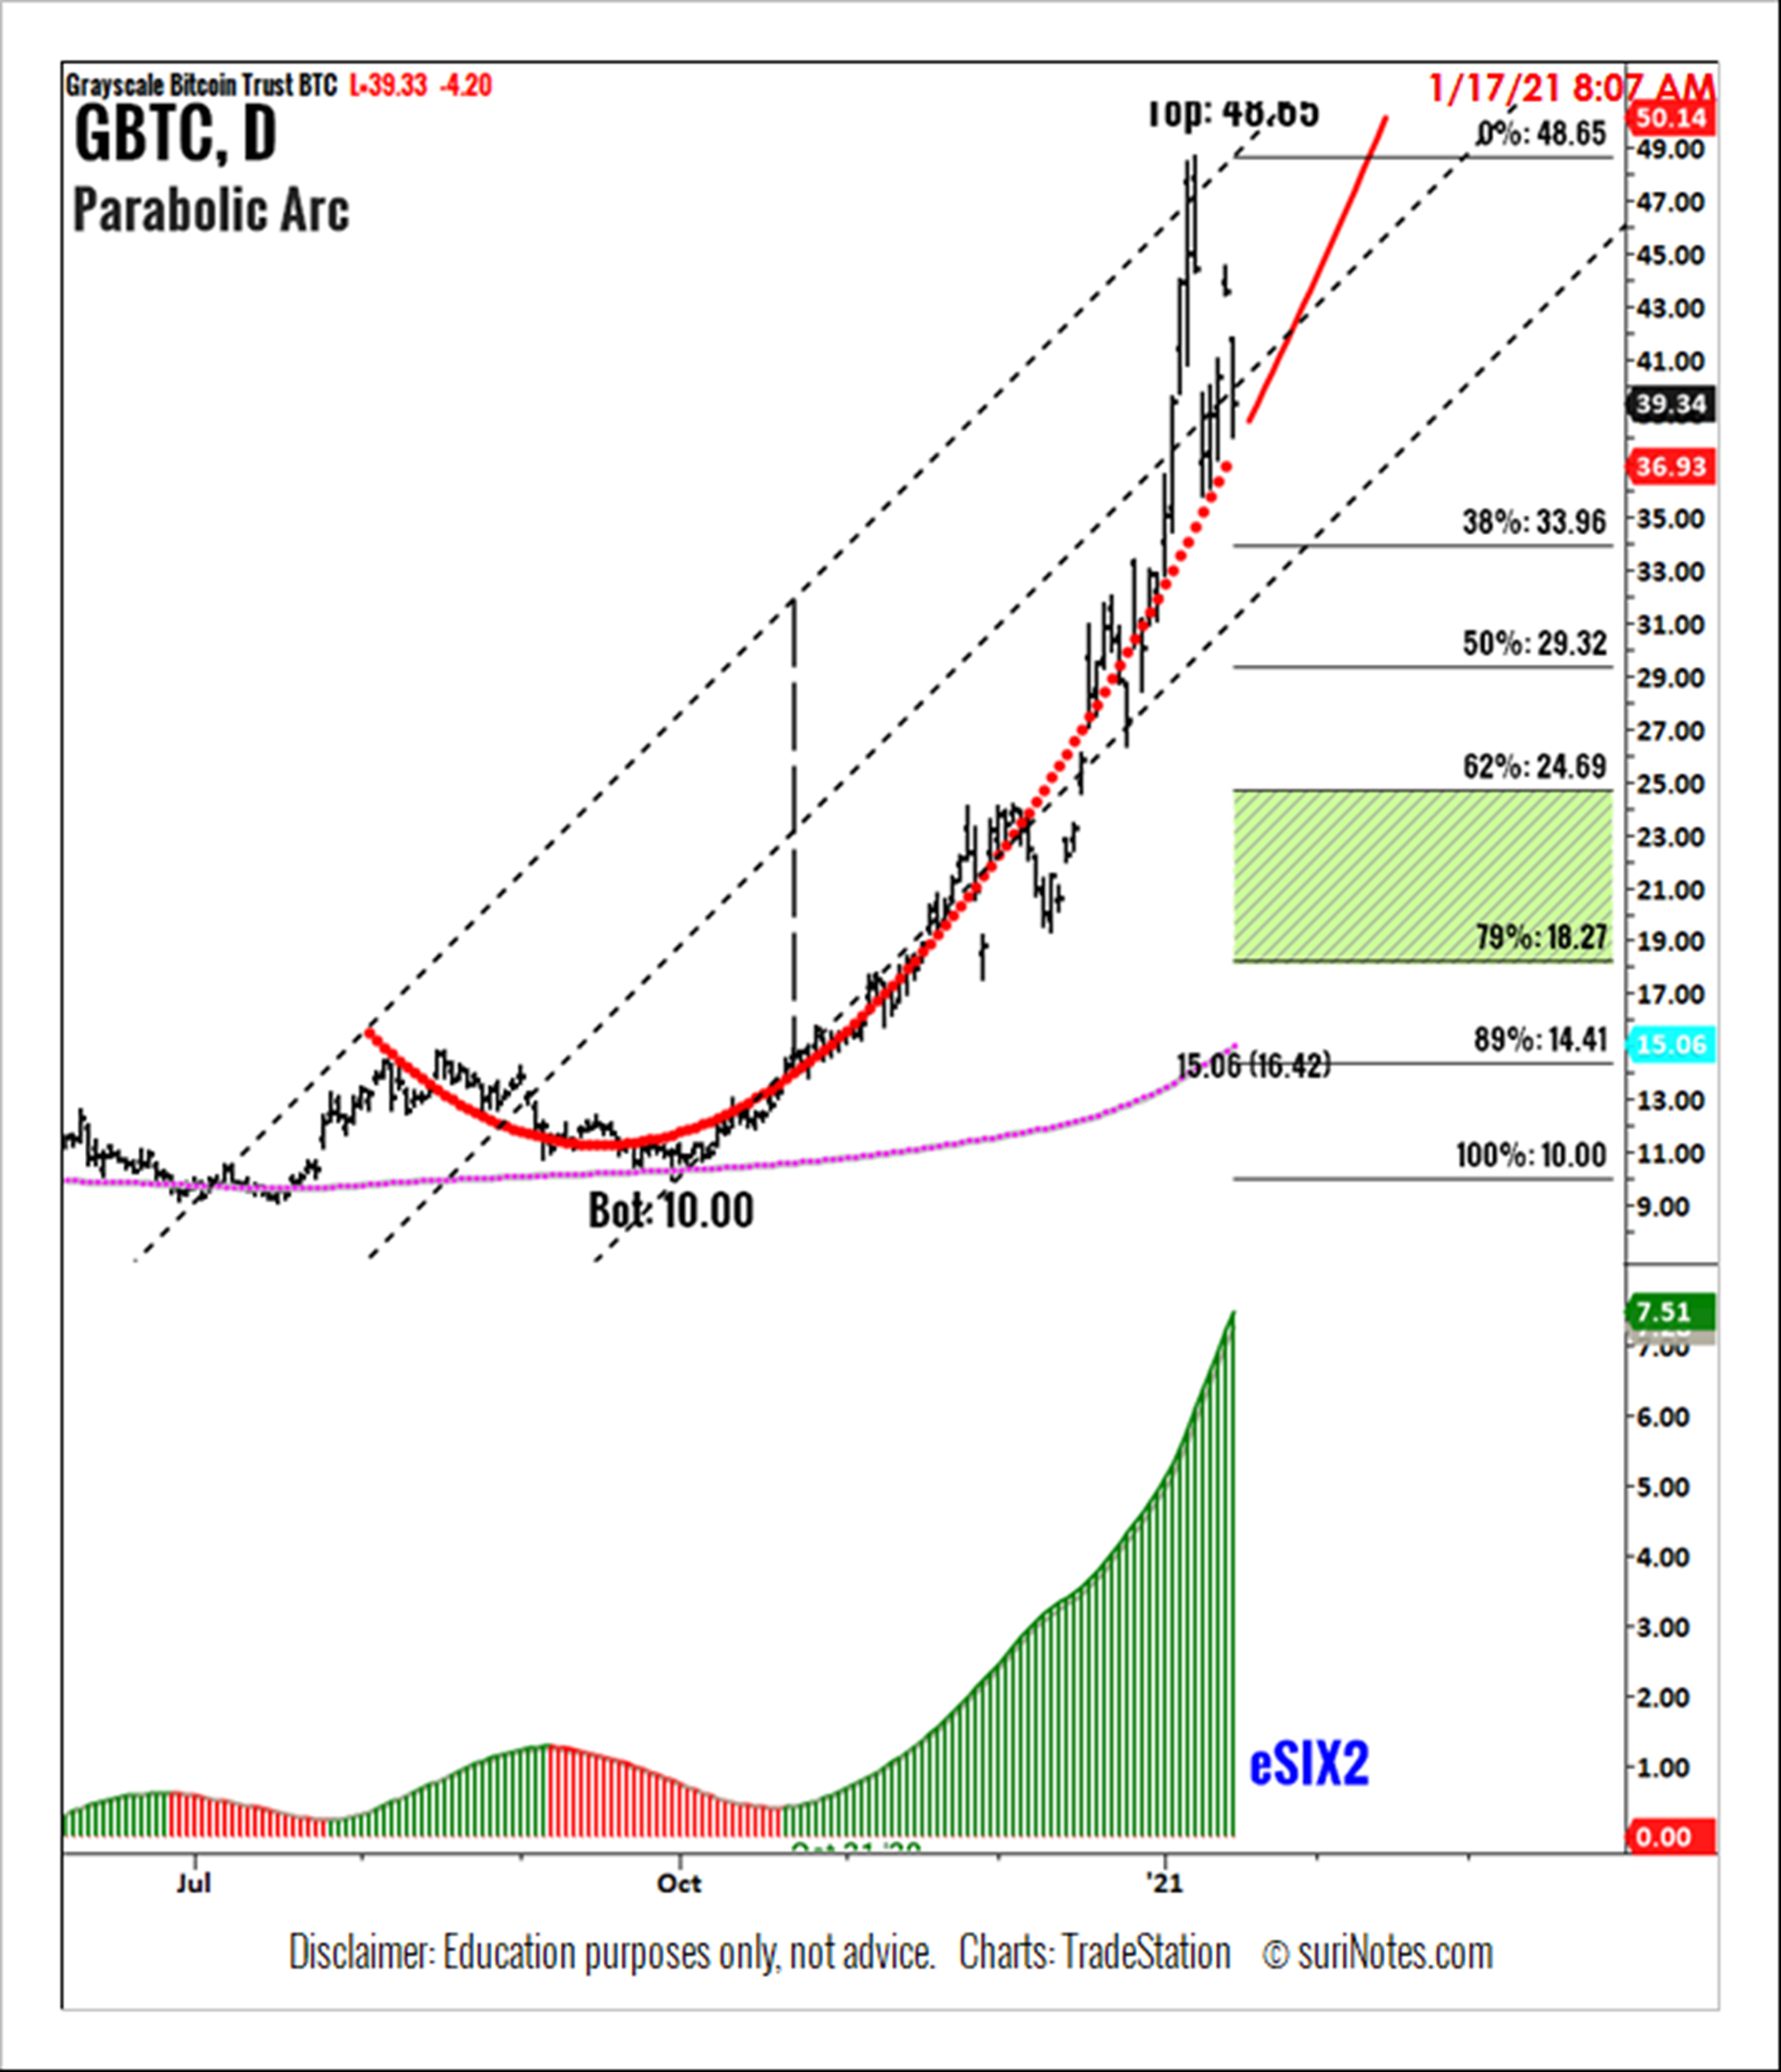
Grayscale Bitcoin Trust (GBTC) Parabolic Arc Pattern
GBTC (Daily) is trading in parabolic arc from 09/30/2020 (low: 10.00) to 01/15/2021 (high: 48.65). Parabolic arc patterns are long-term patterns, but most of the upside parabolic patterns return to at least 50-62% of its prior rise in a correction mode.
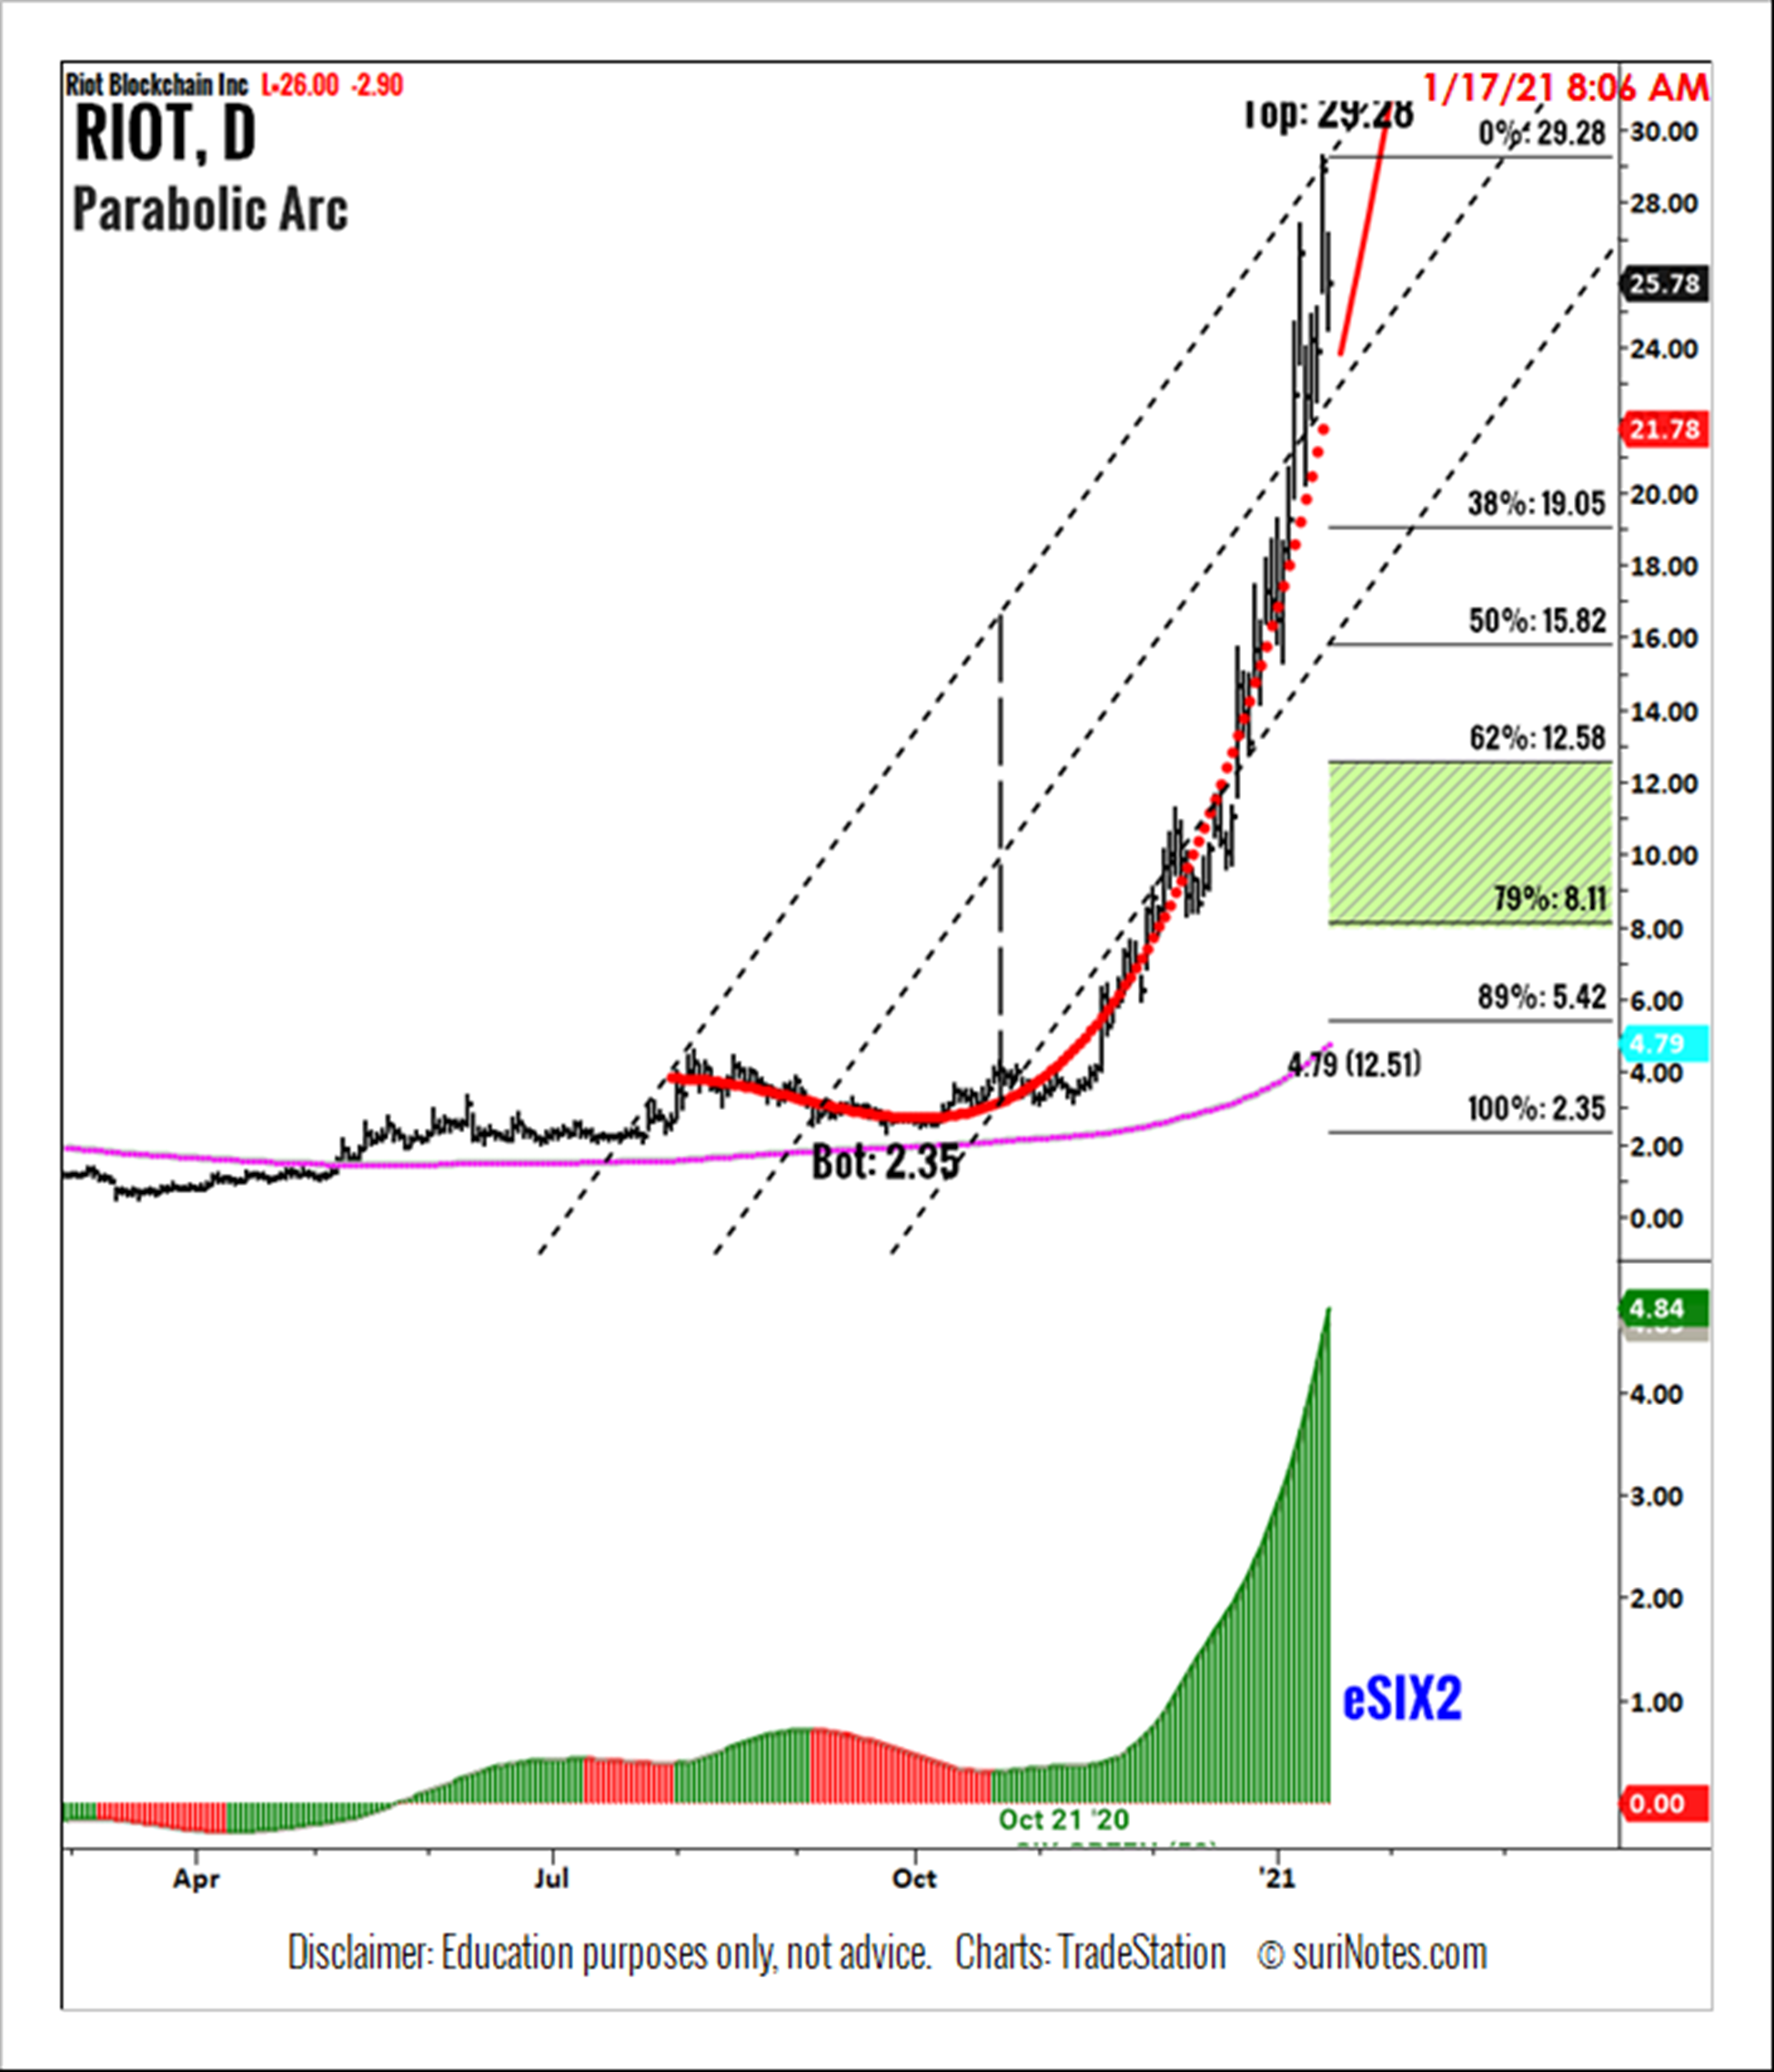
RIOT Blockchain Inc. (RIOT) Parabolic Arc Pattern
RIOT (Daily) is trading in parabolic arc from 09/24/2020 (low: 2.35) to 01/15/2021 (high: 29.28). Parabolic arc patterns are long-term patterns, but most of the upside parabolic patterns return to at least 50-62% of its prior rise in a correction mode.
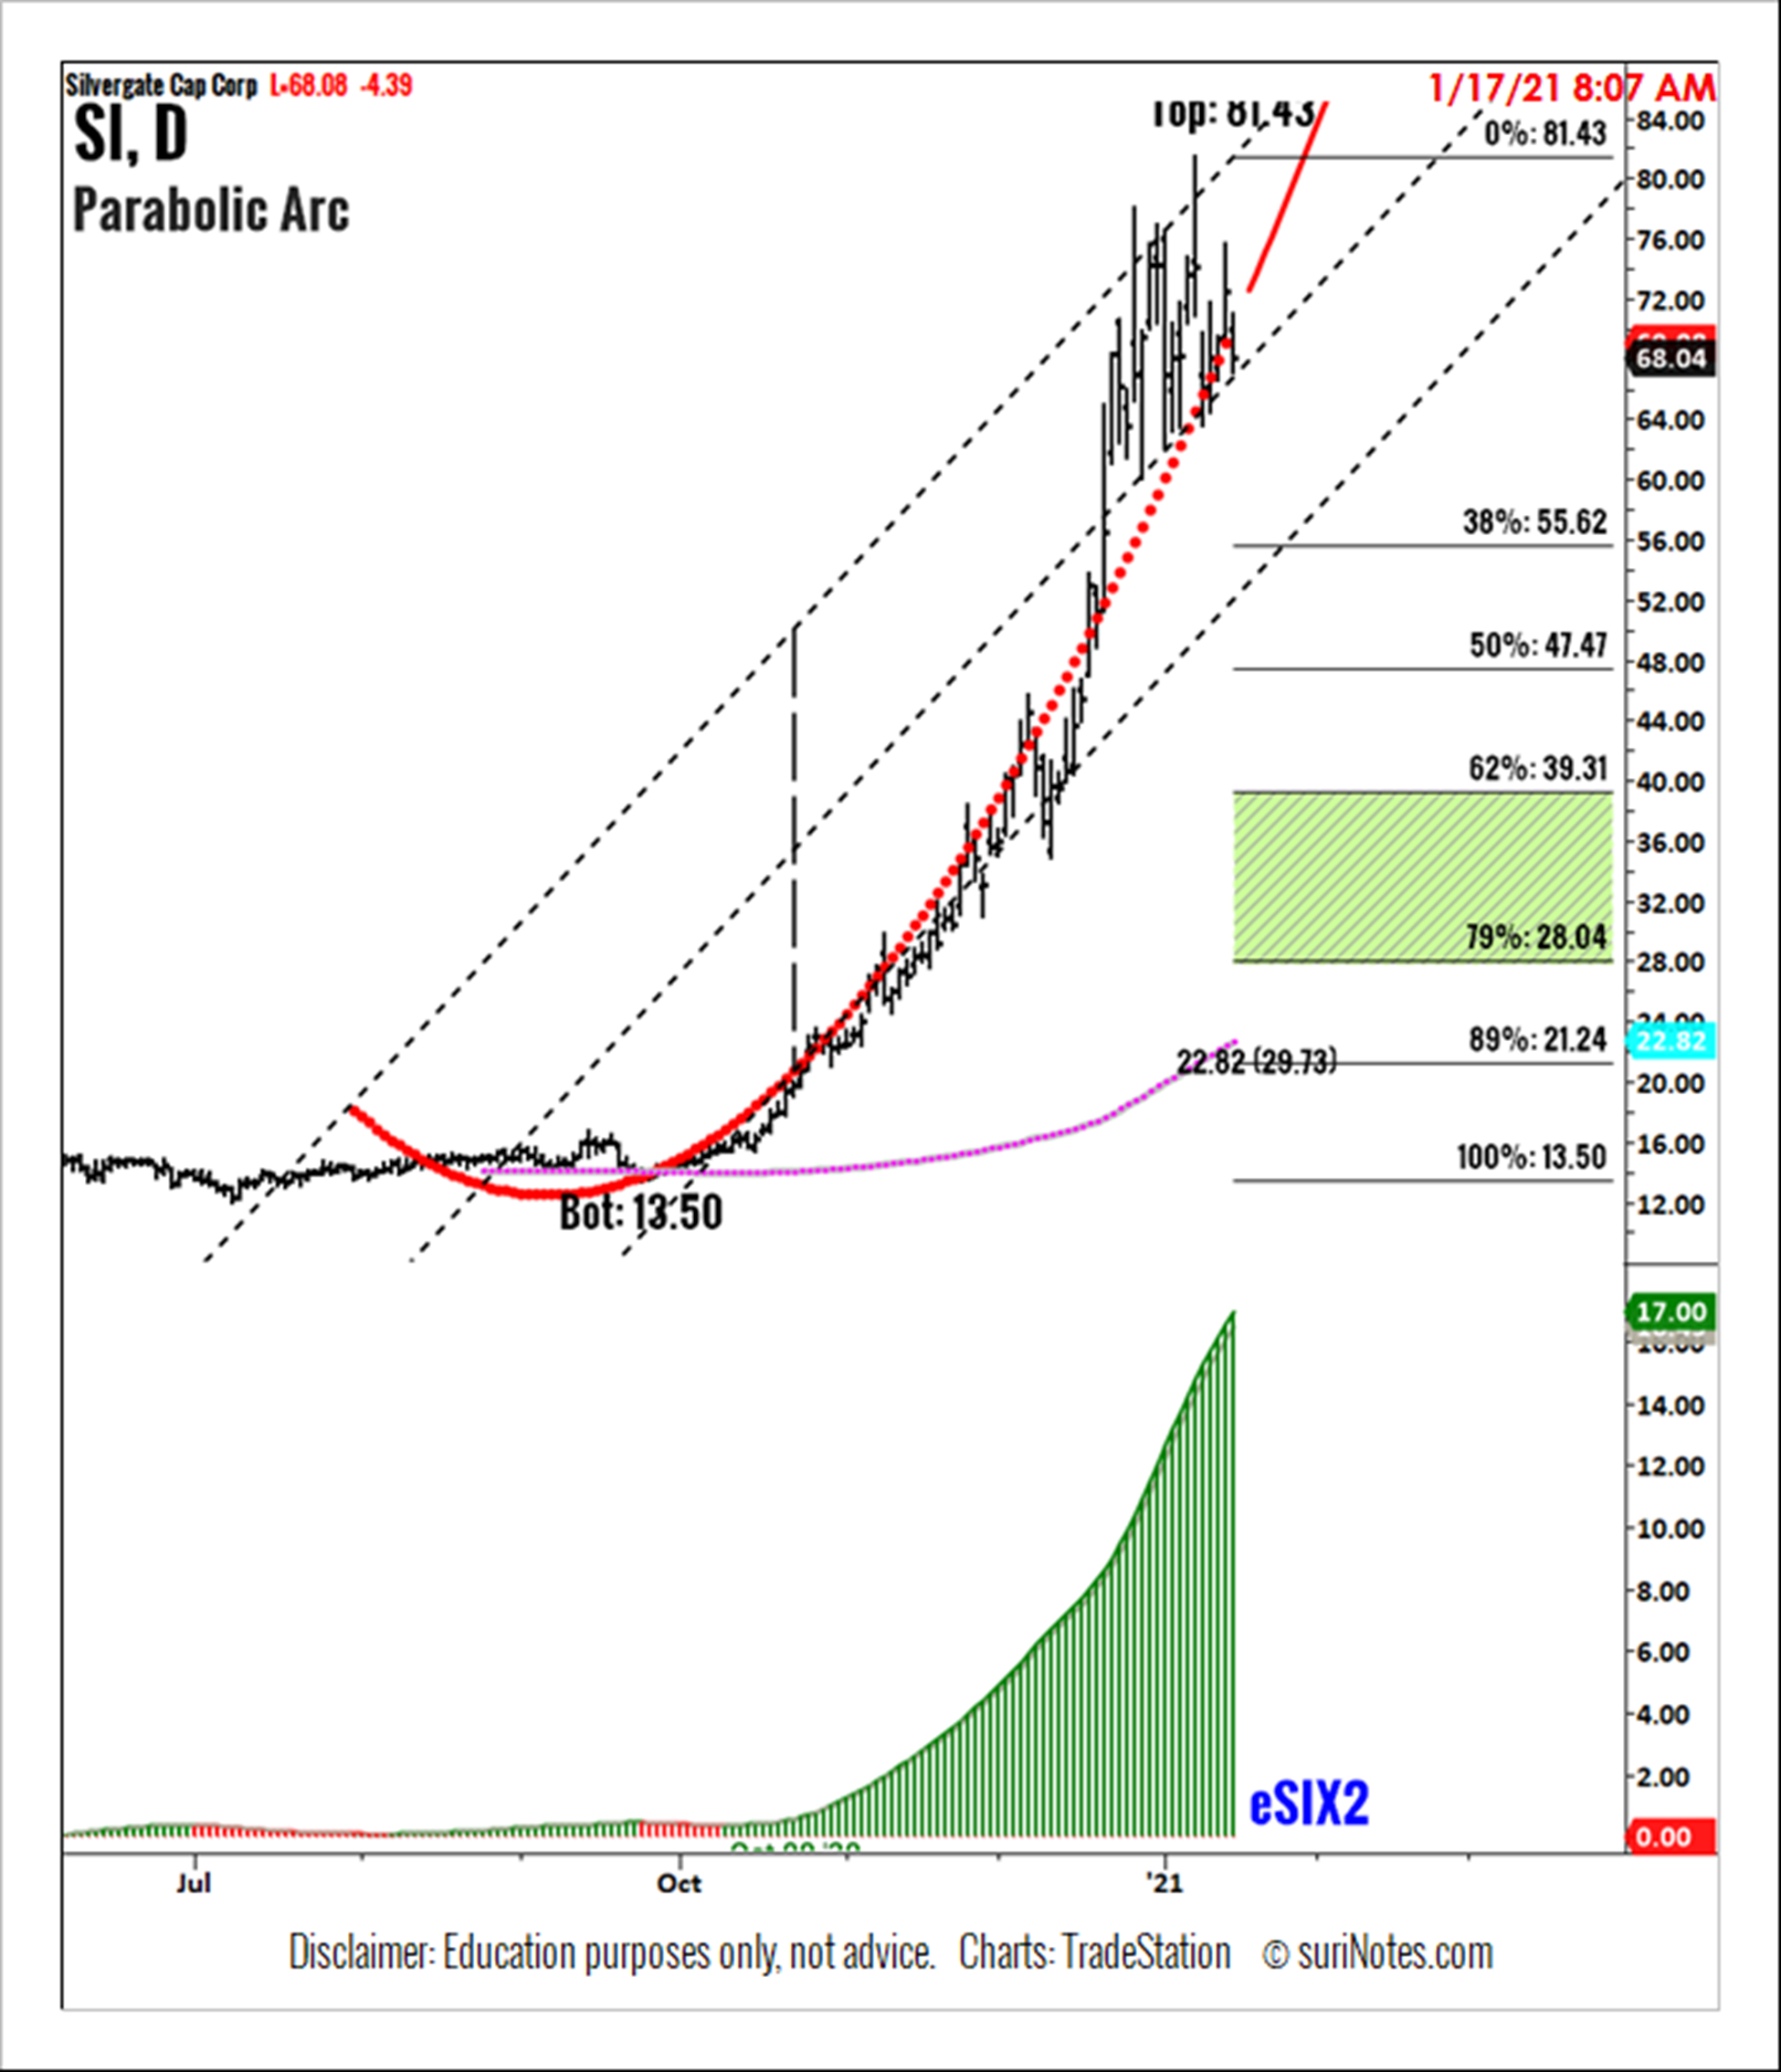
Silvergate Corp. (SI) Parabolic Arc Pattern
SI (Daily) is trading in parabolic arc from 09/24/2020 (low: 13.50) to 01/15/2021 (high: 81.43). Parabolic arc patterns are long-term patterns, but most of the upside parabolic patterns return to at least 50-62% of its prior rise in a correction mode.
To learn more about Suri Duddella, please visit SuriNotes.com.


