July has come and gone, and now our attention is set to August, and Frank Ochoa of PivotBoss.com has some great August seasonality stats for you, one of which could provide a great trade to end the year.
August Seasonality Stats
Historically speaking, August can be a very quiet month for trading. However, August has been a fairly active month over the last four years for the E-mini S&P 500. As a matter of fact, the last four years have shown an average move of about 4%, whereas price has moved an average of just 2.34% during the last ten August months.
During the last 10 years:
- August has been up seven times and down three times
- The average gain for August was 1.73%
- The average loss for August was 3.77%
- The ES has ended the year above the August low nine of the last 10 years
That last bullet point is a real doozy and could become the basis for my next position trade in the ES. If this stat holds up, it could offer a great trade to end a great year.
The E-mini S&P 500 closed July at 1680.50. Given the average gain of 1.73% during the month of August the last ten years, we can forecast an upside target of 1709.50. The average August loss of 3.77% forecasts a decline to 1617.15 by the end of the month, which could become a great zone to buy value heading into the end of the year.
An average up or down August of 2.34% forecasts 1719.75 and 1641.25, the latter of which coincides with the 38.2% Fib level of 1642.16, as figured from the June low to the July high.
Max Reversal Setup
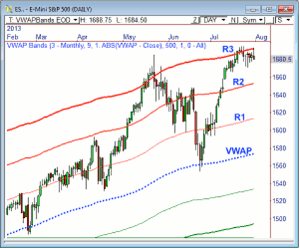
The daily chart of the E-Mini S&P 500 shows a year-to-date VWAP (blue dotted line) along with standard deviation bands above and below VWAP. You’ll notice the ES has formed what I call the max reversal setup, whereby price closes outside the top band (3rd standard deviation) and then reverses to close back below the top band within a few days, triggering a sell signal.
Typically speaking, this signal usually produces a move back to the 1st standard deviation line, followed by a secondary move back to VWAP. As a matter of fact, if you look back to May, the max reversal setup fired a sell signal on the close of May 22, which helped you play to a move back to the 1st standard deviation line at 1597.50, followed by a move down to VWAP at 1561.75.
Will we see a similar move ahead? I don’t know, but the current price behavior around 1692 to 1694 suggests we could see more selling soon. For example, the ES was rejected today upon a retest of the 3rd standard deviation band at 1692. When price rejects the retest, a selloff usually follows, which is exactly what occurred in May as well.
The degree to which the selling picks up steam, however, will depend on how the ES handles key levels below, like 1670, 1666.50, and 1660.50, which could offer tremendous support.
Expansion Ahead
One last bit of analysis, the average weekly range (AWR) has dropped sharply since June, falling to 39.35 from 57.30. Clearly, the last three weeks of trading have seen the ES trade within a highly compressed range, which means we could see a big breakout opportunity ahead.
If the ES can muster the energy to break out from the current range, which spans from 1670 and 1695.50, we could see a very impressive expansion phase over the next two weeks.
By Frank Ochoa of PivotBoss.com


