For the benefit of investors and traders interested in learning new trading methodologies, Mike Turner, of Turner Capital Investments, LLC, outlines his market directional approach and details why he’s currently holding cash and looking for entry points in some of the more liquid inverse ETFs.
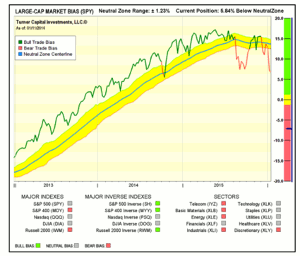
Take a look at my market bias chart of the S&P 500 (SPY), below. If you look closely at this chart, you will see that right at the end of 2015, the market dropped from above the neutral zone (yellow band), to just below it and then bounced back up to the 200-day moving average (blue center line of the Neutral Zone), before moving lower. That action signaled it was time to move to cash, which is exactly what I did for my clients in my Blue Chip Growth strategy.
As such, my clients quietly and comfortably sat on the sidelines last week and did not lose a cent in the worst opening week for any year in over 200 years. Sitting on cash this week was not an accident or just being lucky. This strategy was mathematically calculated. That is also why we were up nicely for 2015 when most of the big-name asset managers lost money in 2015.
Unfortunately, most investors and asset managers fall into one of two groups... buy-and-hold (which got decimated this week) or stock pickers. Then, there are a handful of asset managers who, like myself, use a sophisticated and yet a very common sense market directional approach to investing in the stock market.
To read the entire article click here…
By Mike Turner, Founder & Chief Trading Strategist, Turner Capital Investments, LLC


