

This rally is stalling at a measured move up from the 2-year trading range, according to Al Brooks. He has traded full-time for 30 years and is the author of the 100 hour Brooks Trading Course videos, several books on price action and numerous articles.
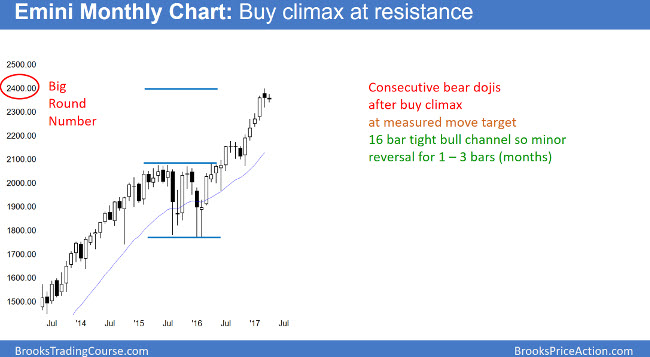
This month’s bar on the monthly S&P500 Emini futures candlestick chart this month is a small doji inside last month’s big doji. Consequently, both are weak follow-through after a 4 month buy climax. In addition, this rally is stalling at a measured move up from the 2-year trading range. Since that range was late in a bull trend, it will probably be the Final Bull Flag.
The monthly S&P500 Emini futures candlestick chart has been in a bull trend for 9 years. Since that is unusual, it is unsustainable. Therefore, the odds are that it pulls back before continuing much higher. Yet the 16-bar tight channel is a sign of eager bulls. Hence, the bulls will probably buy the 1st reversal down. Consequently, the first reversal down will probably be minor. It will therefore probably last only a few bars (months) and become a bull flag.
Since the Emini is at important resistance and in a buy climax, traders are ready for a possible correction. Yet, most corrections need at least a micro double top. Therefore, the downside risk over the next couple of months is small. The bulls will probably buy the 1st pullback. However, if the trend resumption up reverses down again, that would create a micro double top. It would therefore have a higher probability of a reversal back down into the 2014 – 2015 Final Bull Flag.
Breakout above the 2000 and 2007 double top
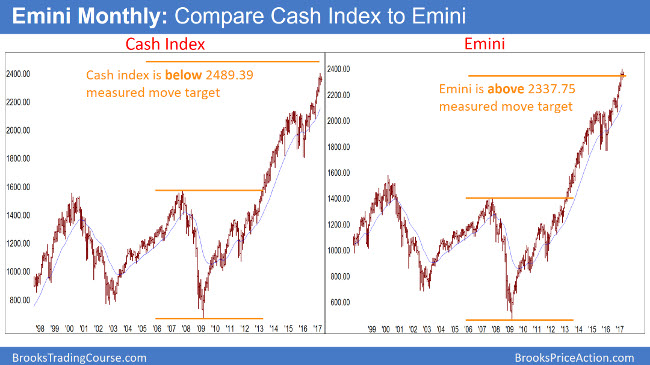
The monthly Emini chart on the right reached one measured move target based on the 2000 and 2007 double top. Yet, the high of the S&P500 cash index on the left is still about 100 points below its target.
Since the bull trend is at important resistance, late in a bull trend, the upside from here is probably small. The Emini is also at a measured move up from the breakout above the double top formed by the 2000 and 2007 highs. But, the measured move target on the cash index is about 100 points above the all-time high. Hence, the rally might continue a little higher before there is a correction on the monthly chart.
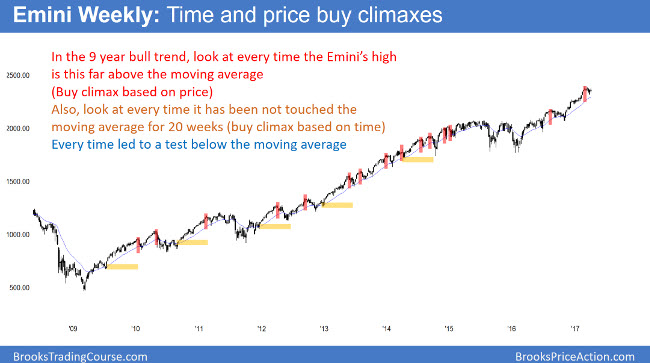
The weekly S&P500 Emini futures candlestick chart had a High 2 buy signal last week. This week’s rally above last week’s high therefore triggered the buy. Yet, this week was a doji bar. It therefore represents weak buying. Most noteworthy is that a chart has two variables, price and time. Since the all-time high is far above the moving average, the price is climactic. Because the Emini has been above the average for a long time, time is climactic as well.
The weekly S&P500 Emini futures candlestick chart’s high was unusually far above the moving average. Look back at every instance when the weekly chart rallied far above its moving average during the 9-year bull trend. In every instance, it traded down to below the moving average. Therefore, each was a buy climax that needed a pullback. Will this time be different? While the Emini might rally to a new high, it probably will not get much higher without a pullback below the moving average.
Furthermore, it has been above the moving average for 21 bars. Since that is unusual, it is another sign of unsustainable price action. Hence, it is another form of buy climax. Hence, the rally is climactic in terms of price and time. When there is a buy climax, the bulls are hesitant to buy for about 10 bars. They want to wait to see if the bears can create a reversal. If the bears fail after 10 or more bars and 2 or more legs, the bulls will buy again, and the bull trend will resume. The odds are that this 4-week pullback is not enough. Furthermore, all other buy climaxes in the past 9 years pulled back below the weekly moving average.
Odds are against the bulls near-term, despite a bull trend
Because of buy climaxes based on price and time, the odds of much higher prices without a pullback below the average are small. Hence, the Emini is probably in a correction that will last another month or two. The Emini should test the close of 2016, and the Dow should fall below 20,000. Alternatively, it might rally to one more minor high and then begin the correction.
Daily S&P500 Emini futures candlestick chart:
Likely five percent correction and retracement of 2017 gains
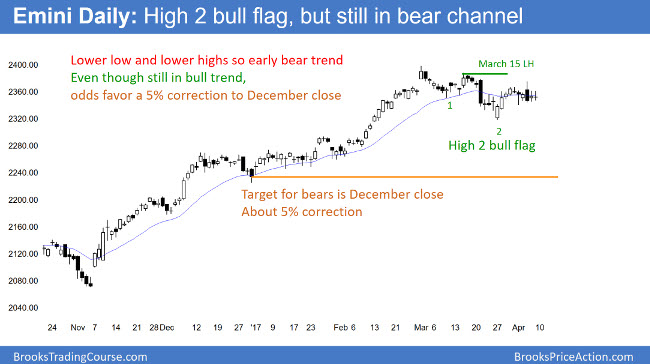
The daily S&P500 Emini futures candlestick chart has been in a tight trading range for 2 weeks. Furthermore, that range is in the middle of a 2-month range. The bulls see a rally up from a High 2 bull flag. The bears see an early bear trend, with lower highs and a lower low.
The daily S&P500 Emini futures candlestick chart is in an early bear trend. As long as the bears prevent a rally above the March 15 major lower high, the bears have lower highs and lows. Hence, it is a bear trend. Yet, if the bulls break strongly above that high, the rally will probably continue for a measured move up.
Because the weekly chart is in an extreme buy climax, it is more likely that the daily chart is in an early bear trend. Yet, the 2-month tight trading range make the probability only slightly better than 50% for the bears. Until the bears get a strong break below the March 27 major low, traders will not believe that the 5% correction is underway.
Furthermore, if the bears get that breakout, the odds would be 60% that the Emini has begun a 5% correction down to below the weekly moving average. Once there, the odds would favor a retracement of the entire 2017 rally and a test of the December close.
Daily bear trend, but monthly bull flag
While a 3 month, 5% correction on the daily chart is a bear trend, it is simply a pullback on the monthly chart. Therefore, the odds are that the correction will be a bull flag on the monthly chart. Consequently, the bulls will buy it, correctly expecting a test of the all-time high. If the Emini reverses down from that test, the bears will have a major trend reversal.
Hence, they will have a 40% chance of a test of the bottom of the Final Bull Flag on the monthly chart at around 1,800.


