

A number of factors are lining up that may create a massive price correction in the near future, asserts Chris Vermeulen, founder of TheGoldAndOilGuy.com and TheTechnicalTraders.com.
Get Trading Insights, MoneyShow’s free trading newsletter »
A quick look at any of the U.S. majors will show most investors that the markets have recently been pushing upward towards new all-time highs. These traditional market instruments can be misleading at times when relating the actual underlying technical and fundamental price activities. Today, we are going to explore some research using our custom index instruments that we use to gauge and relate more of the underlying market price action.
What if we told you to prepare for a potentially massive price swing over the next few months? What if we told you that the U.S. and global markets are setting up for what could be the “October Surprise of 2017” and very few analysts have identified this trigger yet? Michael Bloomberg recently stated, “I cannot for the life of me understand why the market keeps going up.”
Advertisement
Our research team has dedicated many hours into developing a series of specialized modeling systems and analysis tools to assist us in finding successful trading opportunities as well as key market fundamentals. In the recent past, we have accurately predicted multiple CBOE Volatility Index (VIX) spikes, in some cases to the exact day, and market signals that have proven to be great successes for our clients. Today, we’re going to share with you something that you may choose to believe or not – but within 60 days, we believe you’ll be searching the internet to find this article again knowing ATP (ActiveTradingPartners.com) accurately predicted one of the biggest moves of the 21st century.
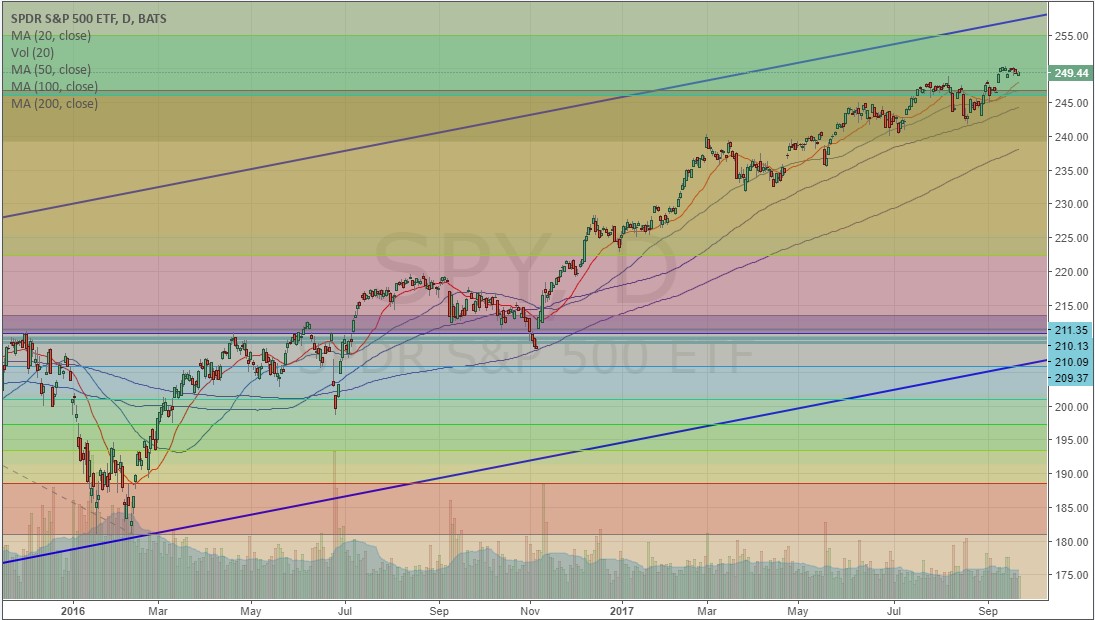
Let’s start with the SPDR S&P 500 ETF (SPY). From the visual analysis of the chart, below, it would be difficult for anyone to clearly see the fragility of the U.S. or global markets. This chart is showing a clearly bullish trend with the perception that continued higher highs should prevail.
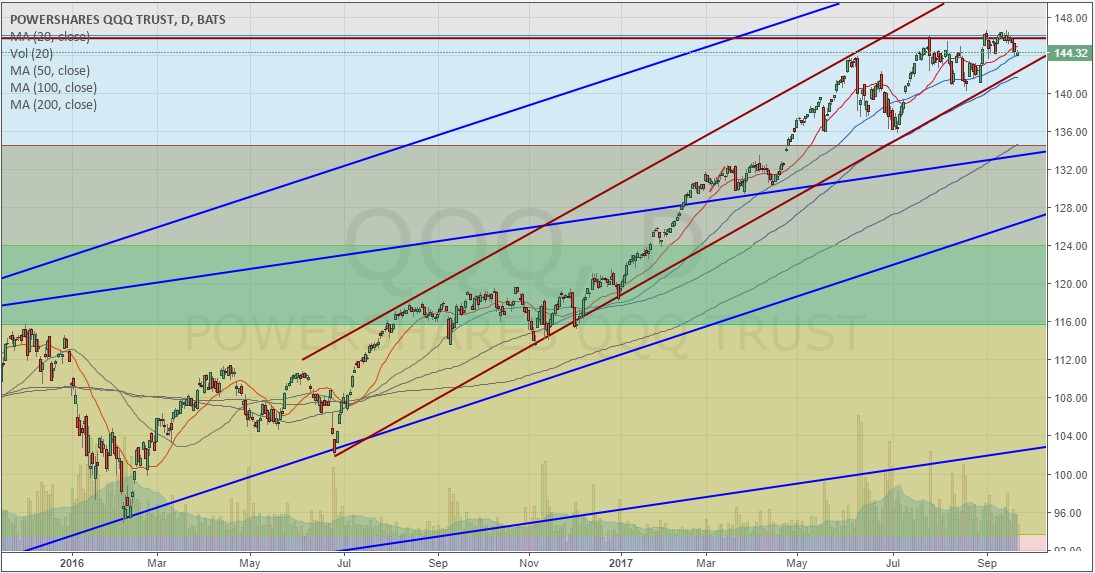
Additionally, when we review the PowerShares QQQ Trust Series 1 ETF (QQQ) we see a similar picture. Although the volatility is typically greater in the NASDAQ vs. the S&P, the QQQ chart presents a similar picture. Strong upward price activity in addition to historically consistent price advances. What could go wrong with these pictures – right?
Recently, we shared some research with you regarding longer-term time/price cycles (3/7/10 year cycles) and prior to that, we’ve been warning of a Sept. 28~29, 2017 VIX spike that could be massive and a game changer in terms of trend. We’ve been warning our members that this setup in price is leading us to be very cautious regarding new trading signals as volatility should continue to wane prior to this VIX spike and market trends may be muted and short-lived. We've still made a few calls for our clients, but we’ve tried to be very cautious in terms of timing and objectives.
A number of factors are lining up that may create a massive price correction in the near future.
Over the past 6+ years, capital has circled the globe over and over attempting to find suitable ROI. It is our belief that this capital has rooted into investment vehicles that are capable of producing relatively secure and consistent returns based on the global economy continuing without any type of adverse event. In other words, global capital is rather stable right now in terms of sourcing ROI and capital deployment throughout the globe. It would take a relatively massive event to disrupt this capital process at the moment.
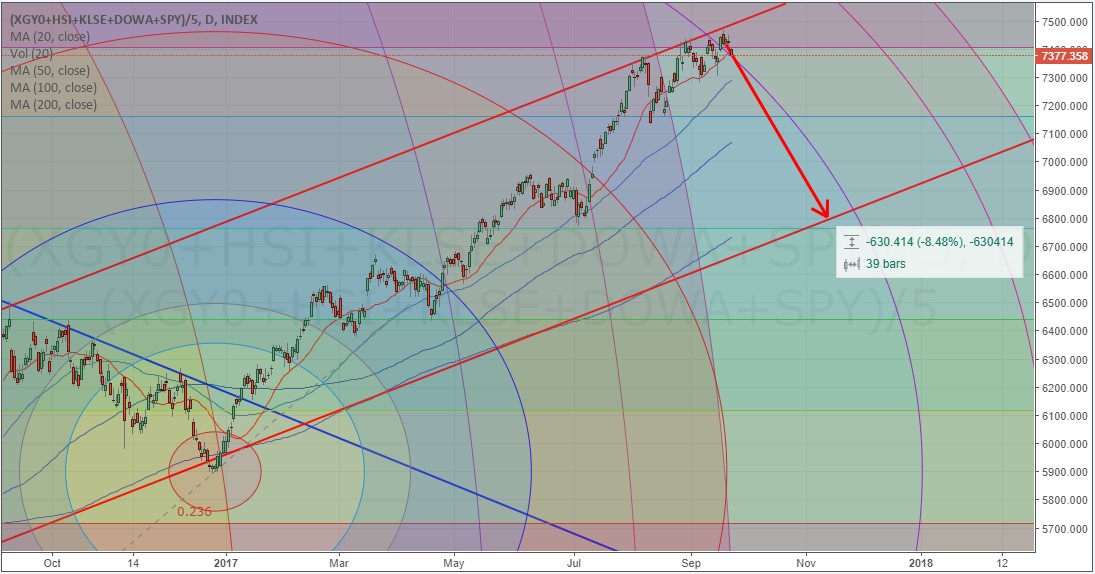
Asia/China are pushing the upper bounds of a rather wide trading channel and price action is setting up like the SPY and QQQ charts, above. A clear upper boundary is evident as well as our custom vibrational/frequency analysis arcs that are warning us of a potential change in price trend. You can see from the red arrow we’ve drawn, any attempt to retest the channel lows would equate to an 8% decrease in current prices.
Still, there is more evidence that we are setting up for a potentially massive global price move. The metals markets are the “fear/greed” gauge of the planet (or at least they have been for hundreds of years). When the metals spike higher, fear is entering the markets and investors avoid share price risks. When the metals trail lower, greed is entering the markets and investors chase share price value.
This custom metals chart should tell you all you need to know. Our analysis is that we are nearing the completion of Wave C within an initial Wave 1 (bottom formation) from the lows in Dec. 2016. Our prediction is that the completion of Wave #5 will end somewhere above the $56 level on this chart (> 20%+ from current levels). The completion of this Wave #5 will lead to the creation of a quick corrective wave, followed by a larger and more aggressive upward expansion wave that could quickly take out the $75~95 levels. Quite possibly before the end of Q1 2018.
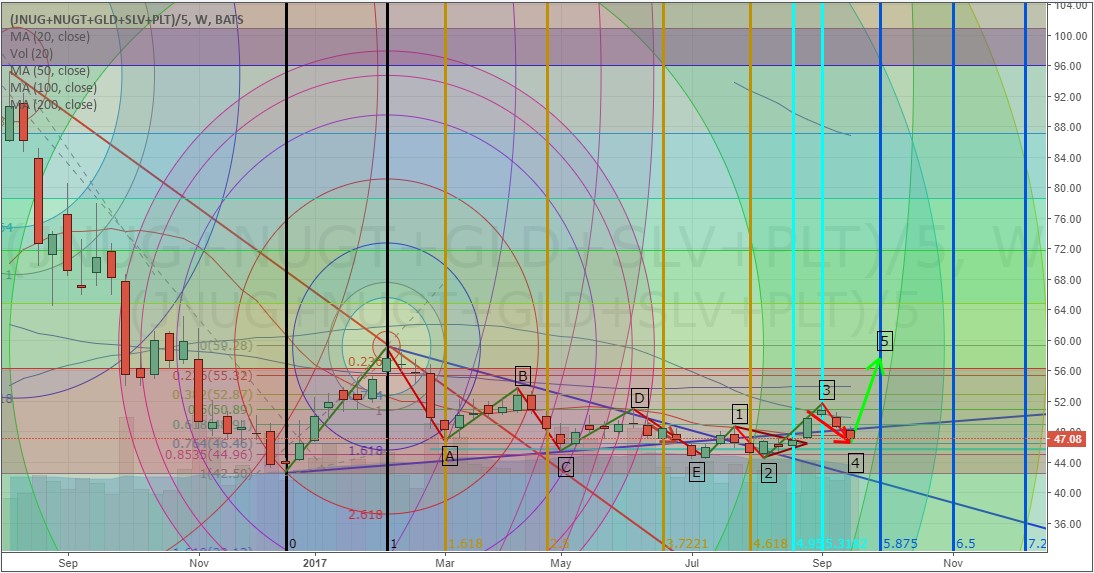
We’ve termed this move the “Rip your face off metals rally.” You can see from this metals chart that we have identified multiple cycles and vibrational/frequency cycles that are lining up between now and the end of 2017. It is critical to understand that in order for this move to happen, a great deal of fear needs to reenter the global markets. What would cause that to happen?
We’ve presented some interesting and, we believe, accurate market technical analysis. We’ve also been presenting previous research regarding our VIX spikes and other analysis that has been accurate and timely. Currently, our next VIX spike projection is Sept. 28~29. We believe this VIX spike could be much larger than the last spike highs and could lead to, or correlate with, a disruptive market event.
We have ideas of what that event might be like, but we don’t know exactly what will happen at this time or if the event will even become evident in early October 2017. All we do know is the following.
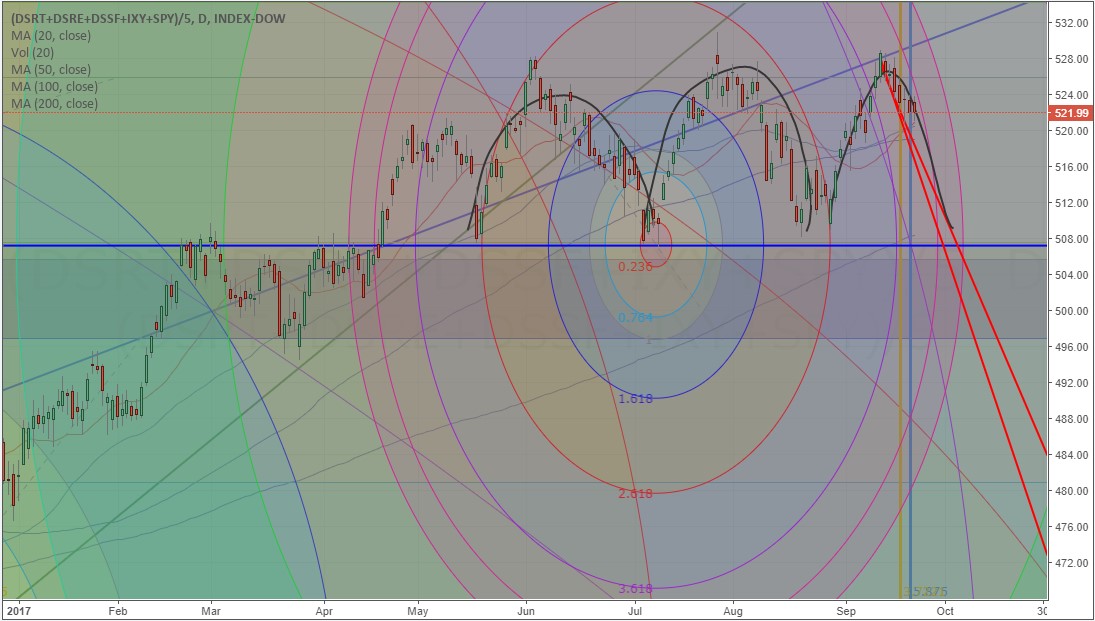
The Head-n-Shoulders pattern we first predicted back in June/July of this year has nearly completed and we have only about 10~14 trading days before the Neck Line will be retested. This is the Hidden Gem. This is our custom U.S. Index that we use to filter out the noise of price activity and to more clearly identify underlying technical and price pattern formations. You saw from the earlier charts that the Head-n-Shoulders pattern was not clearly visible on the SPY or QQQ charts – but on this chart, you can’t miss it.
You can clearly see the correlation of our cycle analysis, the key dates of Sept. 28-29 aligning perfectly with vibrational/frequency cycles originating from the start of the “head” formation. We have only about 10~14 trading days before the Neck Line will likely be retested and, should it fail, we could see a massive price move to the downside.
What you should expect over the next 10~14 trading days is simple to understand.
--Expect continued price volatility and expanded rotation in the U.S. majors.
--Expect the VIX to stay below 10.00 for only a day or two longer before hinting at a bigger spike move (meaning moving above 10 or 11 as a primer).
--Expect the metals markets to form a potential bottom pattern and begin to inch higher as fear reenters the markets
--Expect certain sectors to show signs of weakness prior to this move (possibly technology, healthcare, bio-tech, financials, lending).
--Expect the U.S. majors to appear to dip within a 2~4% range and expect the news cycles to continue the “buy the dip” mantra.
The real key to all of this is what happens after October 1 and for the next 30~60 days after. This event will play out as a massive event or a non-event. What we do know is that this has been setting up for over 5 months and has played out almost exactly as we have predicted. Now, we are 10+ days away from a critical event horizon and we are alerting you well in advance that it is, possibly, going to be a bigger event.
The fact that we called this Head-n-Shoulders formation back in June/July and called multiple VIX Spike events should be enough evidence to consider this call at least a strong possibility.
Subscribe to Chris Vermeulen’s The Gold and Oil Guy newsletter here


