

Picking a top is a losing strategy. Traders know when a market is overbought and likely to correct, but they can never be certain when the correction will come. Only rarely is there a clear pattern, writes Al Brooks. The odds are that the rally will enter a trading range within the next few weeks.
Get Trading Insights, MoneyShow’s free trading newsletter »
Monthly S&P500 Emini futures candlestick chart:
Extremely strong breakout, but climactic
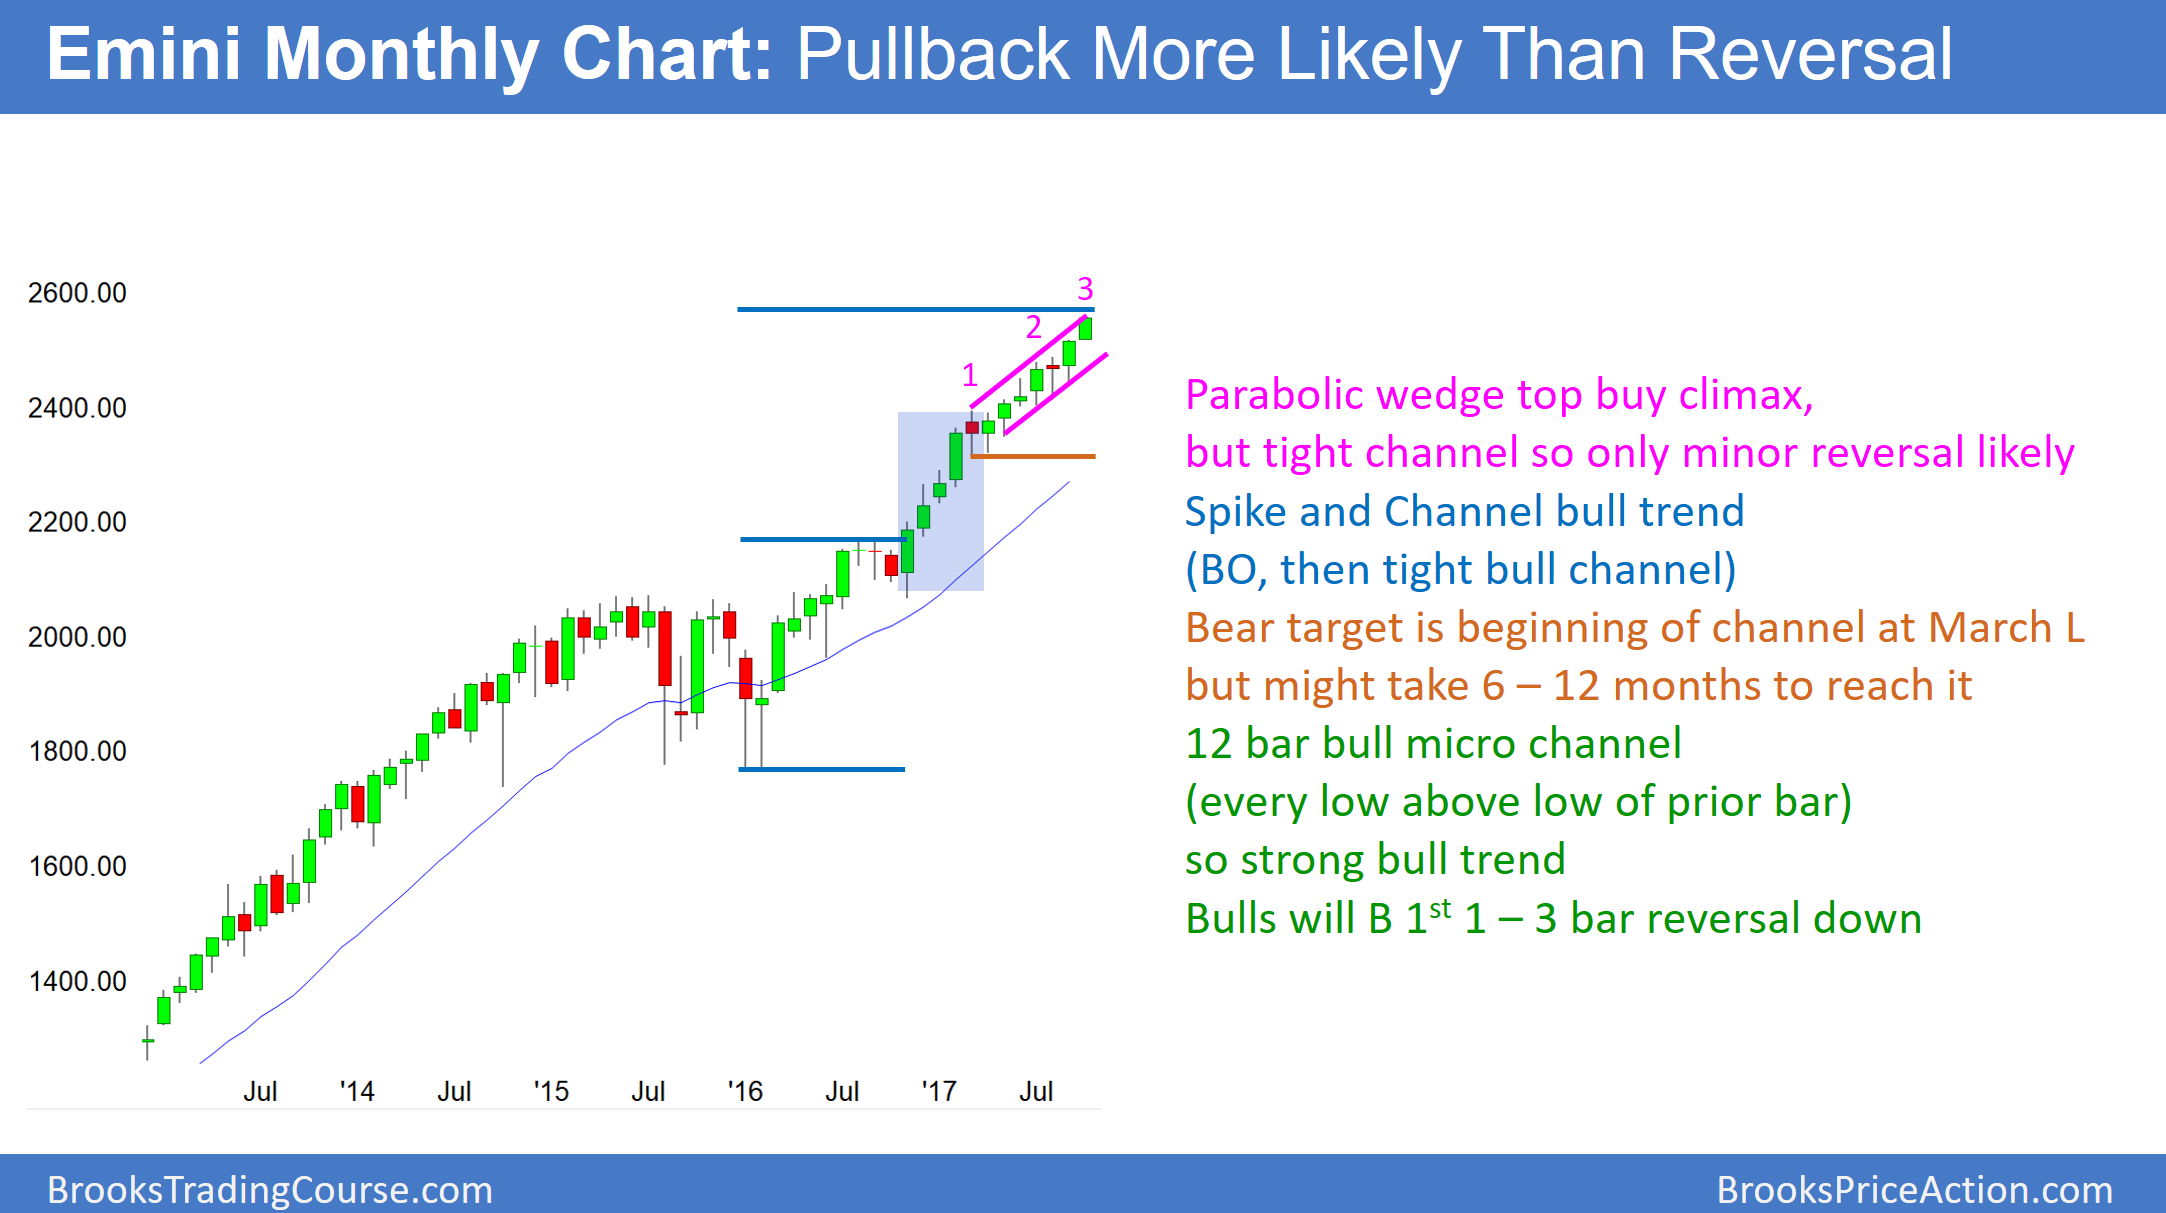
The monthly S&P500 Emini futures candlestick chart is in a 12 bar bull micro channel (every low is above the low of the prior bar). This is an extremely strong bull trend, but it is unsustainable and therefore climactic.
Every bar on the monthly S&P500 Emini futures candlestick chart for the past 12 months has a low above the low of the prior month. The only other time that I can find this happening in the S&P in the past 50 years was in 1995. Then, the pullback came after the 13th month, and it was only a single bar. The rally continued for 5 years and the market quadrupled in price.
A 12 bar bull micro channel is a sign of very aggressive buying. Therefore, the odds are that traders will buy below the low of the prior bar. While the pullback can last a few bars (months), and it sometimes can be 10 – 20% deep, the odds are that the best the bears can get over the next 6 months is a bear leg in a trading range. Even if the bears got a 20% correction, the bulls would probably buy it. This is because they know bull trends only rarely immediately reverse into bear trends. More likely, the 1st pullback will be around 5% and last 1 – 3 months. It would be a bull flag.
Longest streak without a 3% pullback?
The longest that the Emini has gone without a 3% correction in the past 25 years, and possibly in history of the S&P index, is 241 days. That was in 1995. The current streak is now 236 days just 5 days shy of the record. The next longest streak was only 162 days. This tells traders just how unusual the current streak is. Markets always set new records, and this rally is about to set a new one. However, the odds of it becoming much more extreme are small because that is not how markets behave. They usually regress to the mean. This means that they eventually behave like they have done in the past.
How big can a pullback be?
Because the rally is so extreme, the bulls might need 5 – 10 bars before they will buy relentlessly again. Consequently, the rally up from the pullback might only last 1 – 3 bars, and be a part of a tight trading range that could last much longer.
In conclusion, while the monthly bull trend is extremely strong, it is historically overbought. As a result, it will likely have a 100 – 200 point pullback that begins within the next month or two. But, the odds are that it will not be the start of a bear trend.
The yearly chart?
While I do not have a yearly candlestick chart, it would show that this year is a big bull trend bar. On any time frame, when there is a big bull trend bar, there is usually at least a small tail on top. This is usually from profit taking after the strong rally.
The current bar on the yearly chart is over 300 points tall. After an extremely strong bull trend, some firms will take partial profits before the bar closes. This means before the end of the year. This will create a tail on the top of the bar on the yearly chart.
What constitutes a tail? Obviously, a close of the year that is 1 tick below the high is all that is required. However, more likely, the tail will be noticeable. For it to be visible on a yearly chart where the bar is more than 300 points tall, the tail would have to be at least 20 – 50 points tall.
Advertisement
What does a tail on the top of a candlestick bar mean?
Think about that for a moment. If the Emini closes 20 – 50 points below the high of the year, does that mean that the pullback was only 20 – 50 points? Of course not!! The pullback could easily have been 150 points. If the bulls bought that pullback, they could create a rally back up to near the high of the year.
This means that the Emini could selloff 100 – 200 points between now and the end of the year, but then rally to close the year just below the year’s high. I think the odds are that there will be a pullback of at least 100 points before the end of the year. It could be more, but that does not matter. The yearly chart will probably have a visible tail at the top, and the bulls will buy even a 100 – 200 point selloff.
Weekly S&P500 Emini futures candlestick chart:
Pause after buy climax
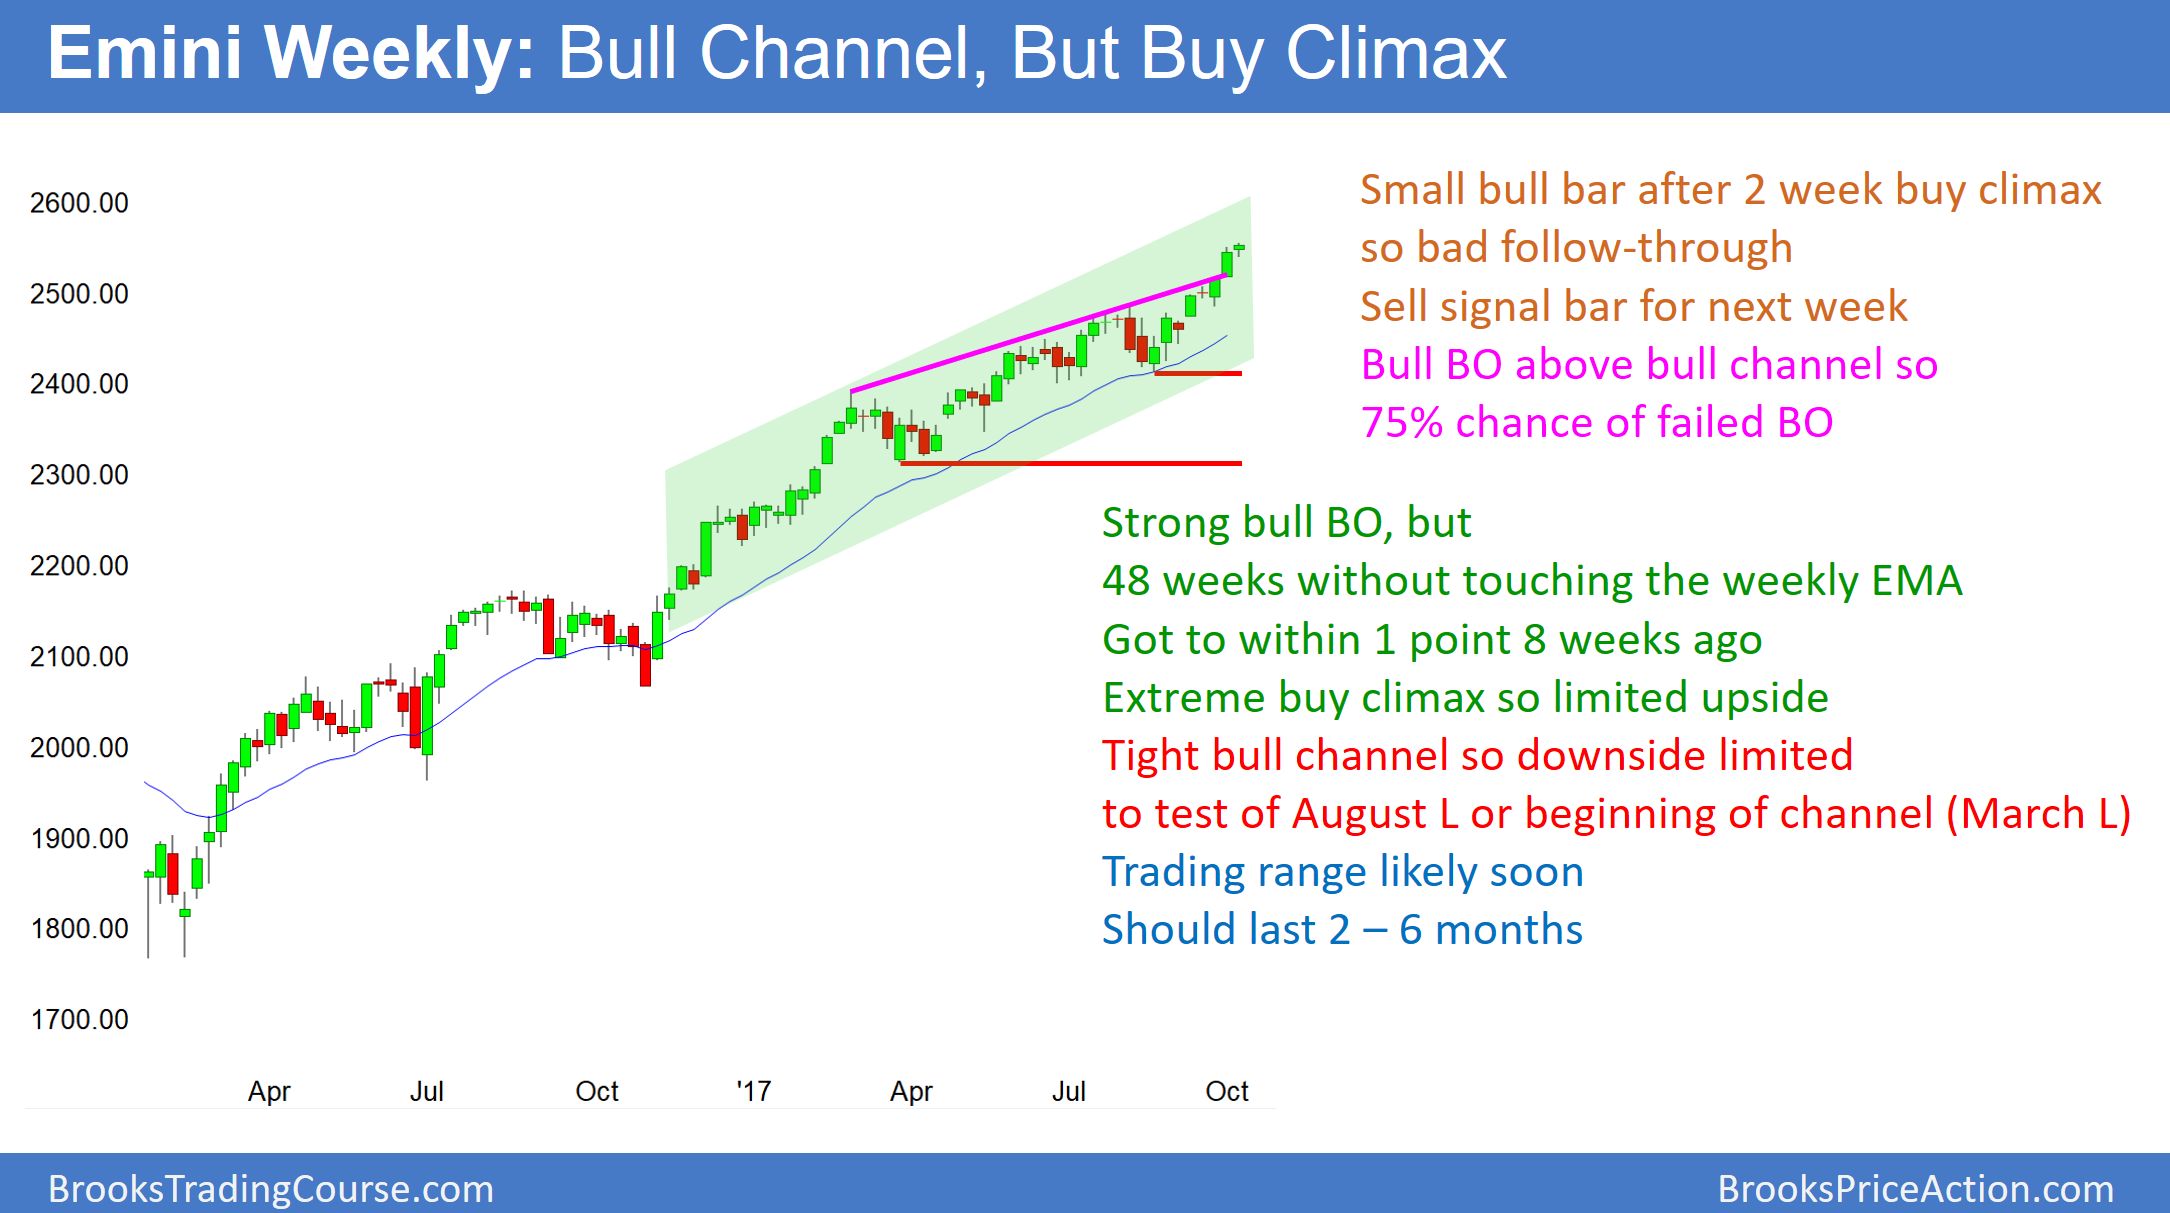
The weekly S&P500 Emini futures candlestick chart has not touched the 20 week exponential moving average in 48 weeks. While this is a sign of strong bulls, it is climactic and therefore unsustainable. Furthermore, a bull breakout above a bull channel usually reverses within 5 weeks.
The weekly S&P500 Emini futures candlestick chart this week formed a small bar after the prior week’s big bull trend bar. Since all bull trend bars are buy climaxes, and that one was big, there is an increased chance of a pause in the bull trend. When a small bar follows a big buy climax, it is bad follow-through. Hence, this past week is a sell signal bar for next week.
The bulls have a breakout above the top of a bull channel. There is only a 25% chance of strong follow-through. In addition, there is a 75% chance of a reversal down below the bottom of the channel beginning within 5 weeks.
20 week exponential moving average
While most reversals fail, the odds favor a pullback soon. The Emini has held above its weekly moving average for this many bars only once in its 18 year history. That was in 2003 when it stayed above for 48 weeks. For several months, I have been saying that the 2003 rally was “about 50 weeks,” but I just counted and it was 48 weeks. I don’t know if there is another rally that stayed above for more than 25 weeks so what is going on now is unusually extreme. The pullback in 2003 began on the 47th week. The Emini then went sideways for 10 months, and the pullback reached 10%.
The current rally has stayed above the average price for 48 bars, just like in 2003. However, the Emini is now far above the average. It will therefore take at least one more week to reach it. Consequently, the current rally is the most extreme buy climax, by this one measure, in the history of the Emini. The odds are that it will end within a few weeks.
Yet, the weekly chart is in a strong bull trend. Therefore, even if the selloff tests the March low, the best the bears can probably get is a bear leg in a trading range. This is true even if the trading range is 200 points tall and lasts several months.
Daily S&P500 Emini futures candlestick chart:
buy climax, but measured move targets slightly higher
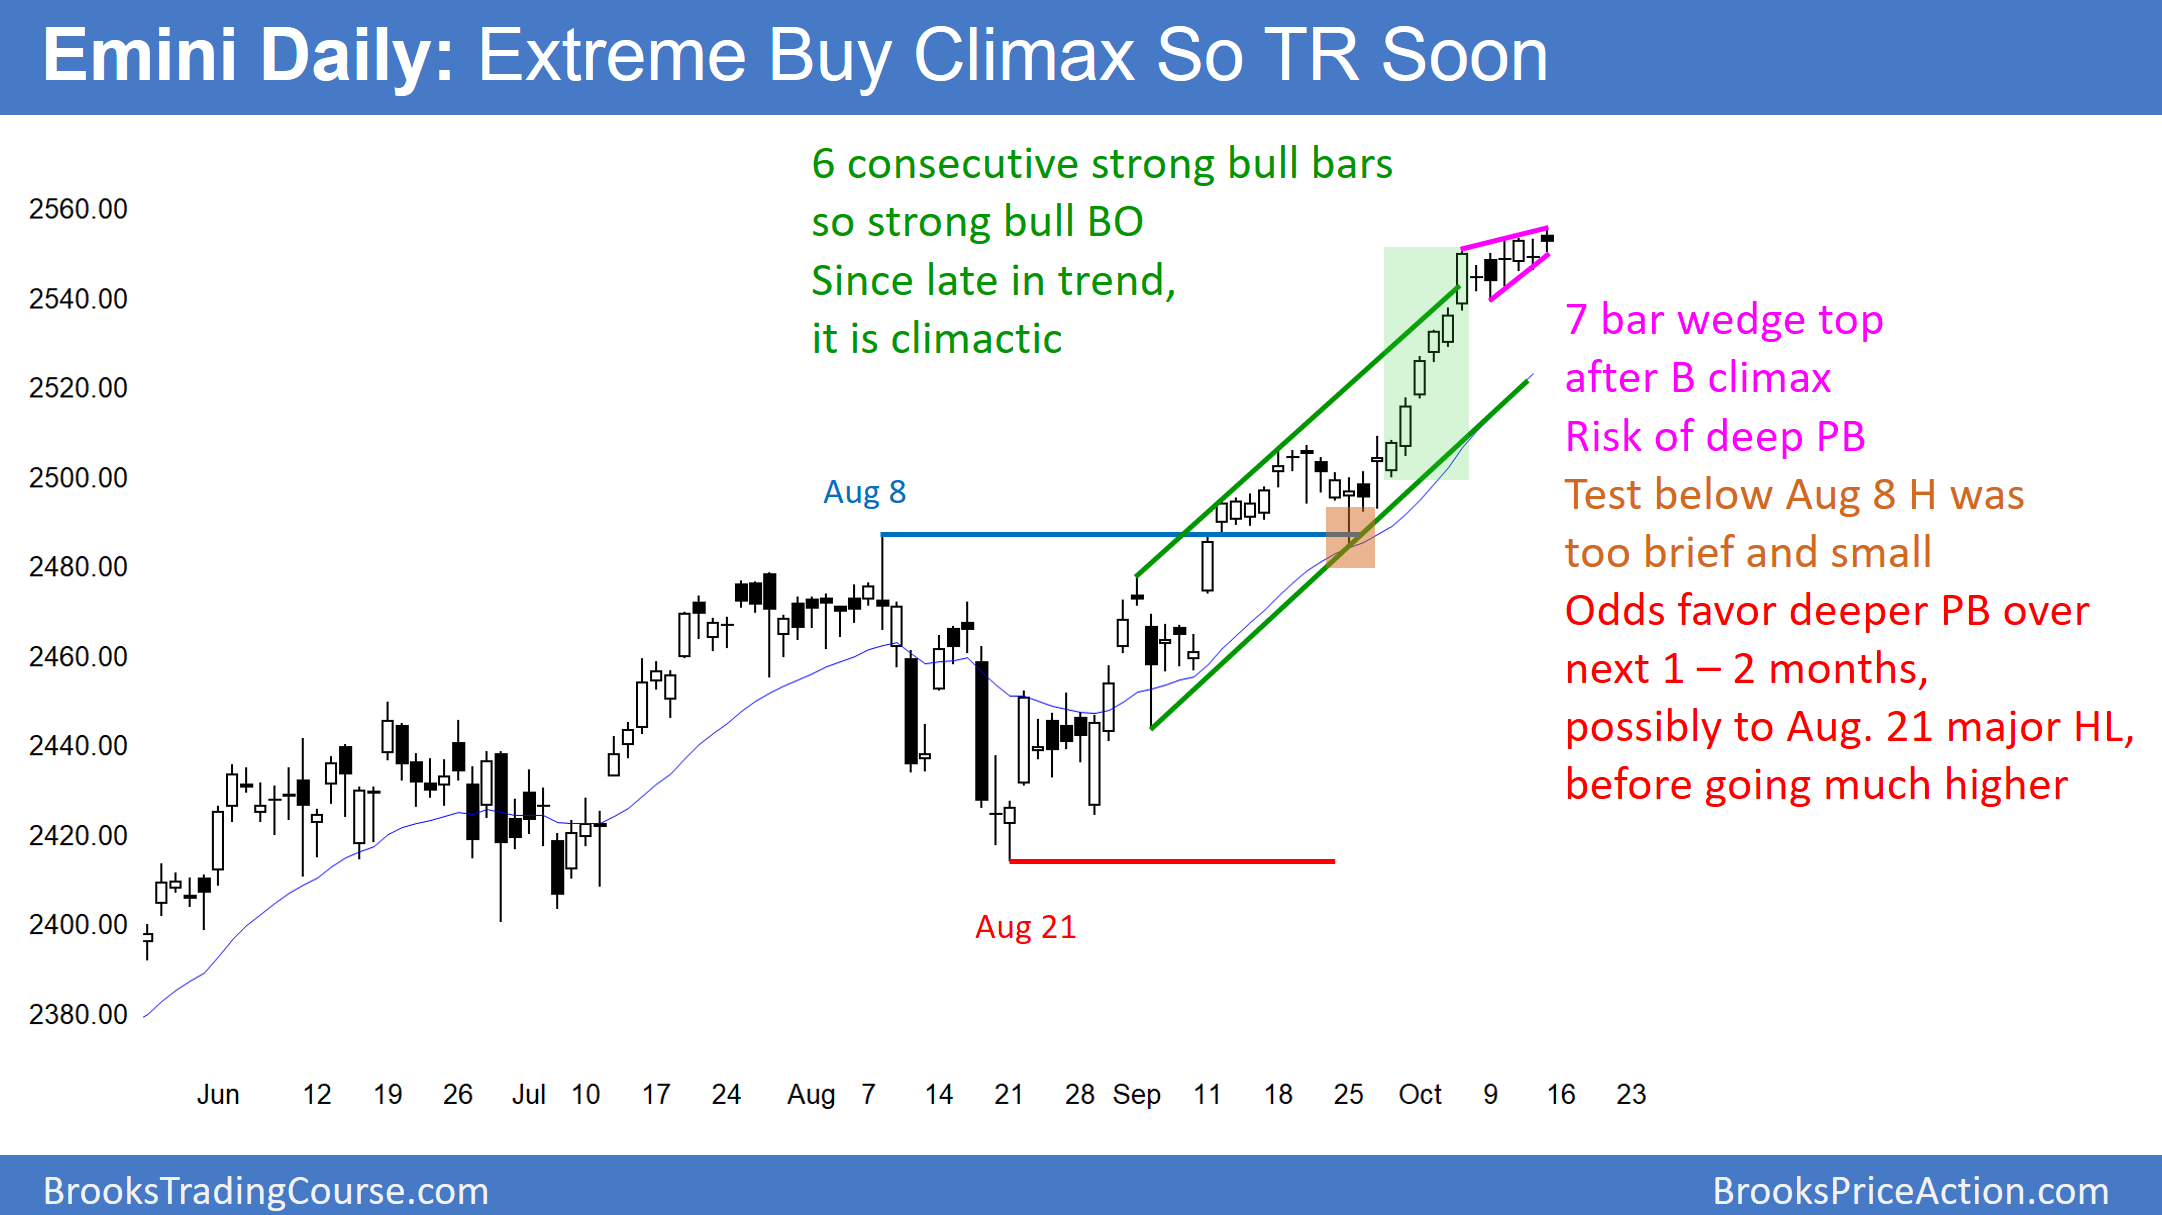
The daily S&P500 Emini futures candlestick chart is in a climactic bull trend. It has formed a small wedge rally for 6 days. Although small, the context is good for a reversal soon.
Two weeks ago, the daily S&P500 Emini futures candlestick chart broke strongly above the top of a 6 month bull channel. It is now at the top of a steeper 2 month bull channel. After the 6 day rally at the start of October, the odds favored at least a small 2nd leg up. The small wedge rally over the past 6 days met that minimum objective.
The bull channel up from the August low is tight and therefore the bull trend is strong. In addition, the 6 day rally since September 28 is exceptionally strong. When there is exceptional strength late in a bull trend, it is more likely a climactic end of the trend and not the start of an even strong leg up. While the 6 day wedge top would typically be minor, the context here is not typical. This small top has a higher probability of signaling the end of the rally up from the August 21 low.
Buy climaxes usually lead to trading ranges, not bear trends
Buy climaxes eventually lead to an end of a trend, and not an opposite trend. Therefore, traders should be ready for the trend to evolve into a trading range. Trading ranges can have deep bear legs. Consequently, the pullback from the high can retrace most or all of the last bull leg. That leg began on August 21 and its low is about 140 points below today’s high.
Picking a top is a losing strategy. Traders know when a market is overbought and likely to correct, but they can never be certain when the correction will come. Only rarely is there a clear pattern. However, since the weekly and monthly charts are historically overbought, the odds are that the rally will enter a trading range within the next few weeks. The pullback from the high will probably be at least 3 – 5%. In addition, a small wedge top at the end of a buy climax can be the start of that correction. As an example, look at the small wedge top on the weekly chart in March, 2004. That led to a 30 bar (week) trading range.


