

If we see higher risk assets further over-valued, do not chase the move, but rather sell into price strength. We are short-term trading, awaiting a test of the bottom of up-trend channels. More on global markets from Ziad Jasani of the Independent Investor Institute.
Video of my Strategy Session for the week recorded Monday at 1 pm EDT:
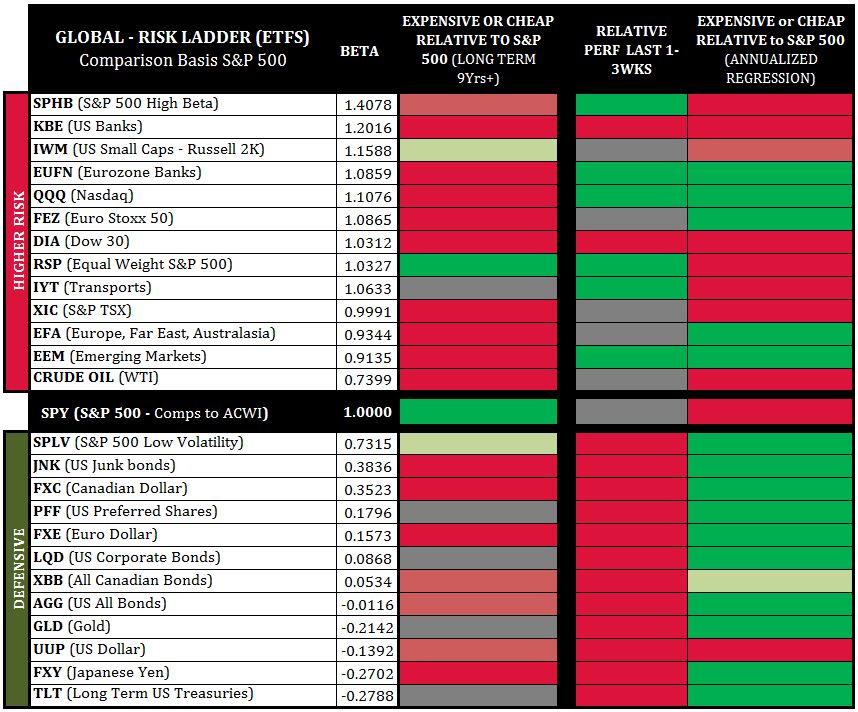
Global Risk Sentiment
Long-Term Equities and Bonds are expensive, driven by nearly a decade of money printing and market stimulation by central banks.
Short-To-Mid-Term (3rd column) Defensive Asset Classes (below the S&P 500 Line) present as relatively cheaper.
Higher Risk Asset Classes (above the S&P 500 line) present largely as scattered.
Areas of opportunity short-term are the Eurozone Financials (EUFN), EFEA (EFA), Euro Stoxx 50 (FEZ), EEM and the Nasdaq (QQQ).
Most Defensive areas present with opportunity in PFF, LQD, CPD-T while equities are holding the highs; and TLT, XBB-T, FXY and GLD/SLV in the event of equities turning down.
The overall configuration of the Global Risk-Ladder is tilted to risk-off where if the S&P 500 is unable to sustain above 2,640 into the week’s end we would look to close short-term positions. And if we see higher risk assets getting further over-valued into week’s end, we would suggest not to chase the move, but rather sell-into-price strength.
We are short-term trading, awaiting a test of the bottom of up-trend channels that started Nov. 2016.
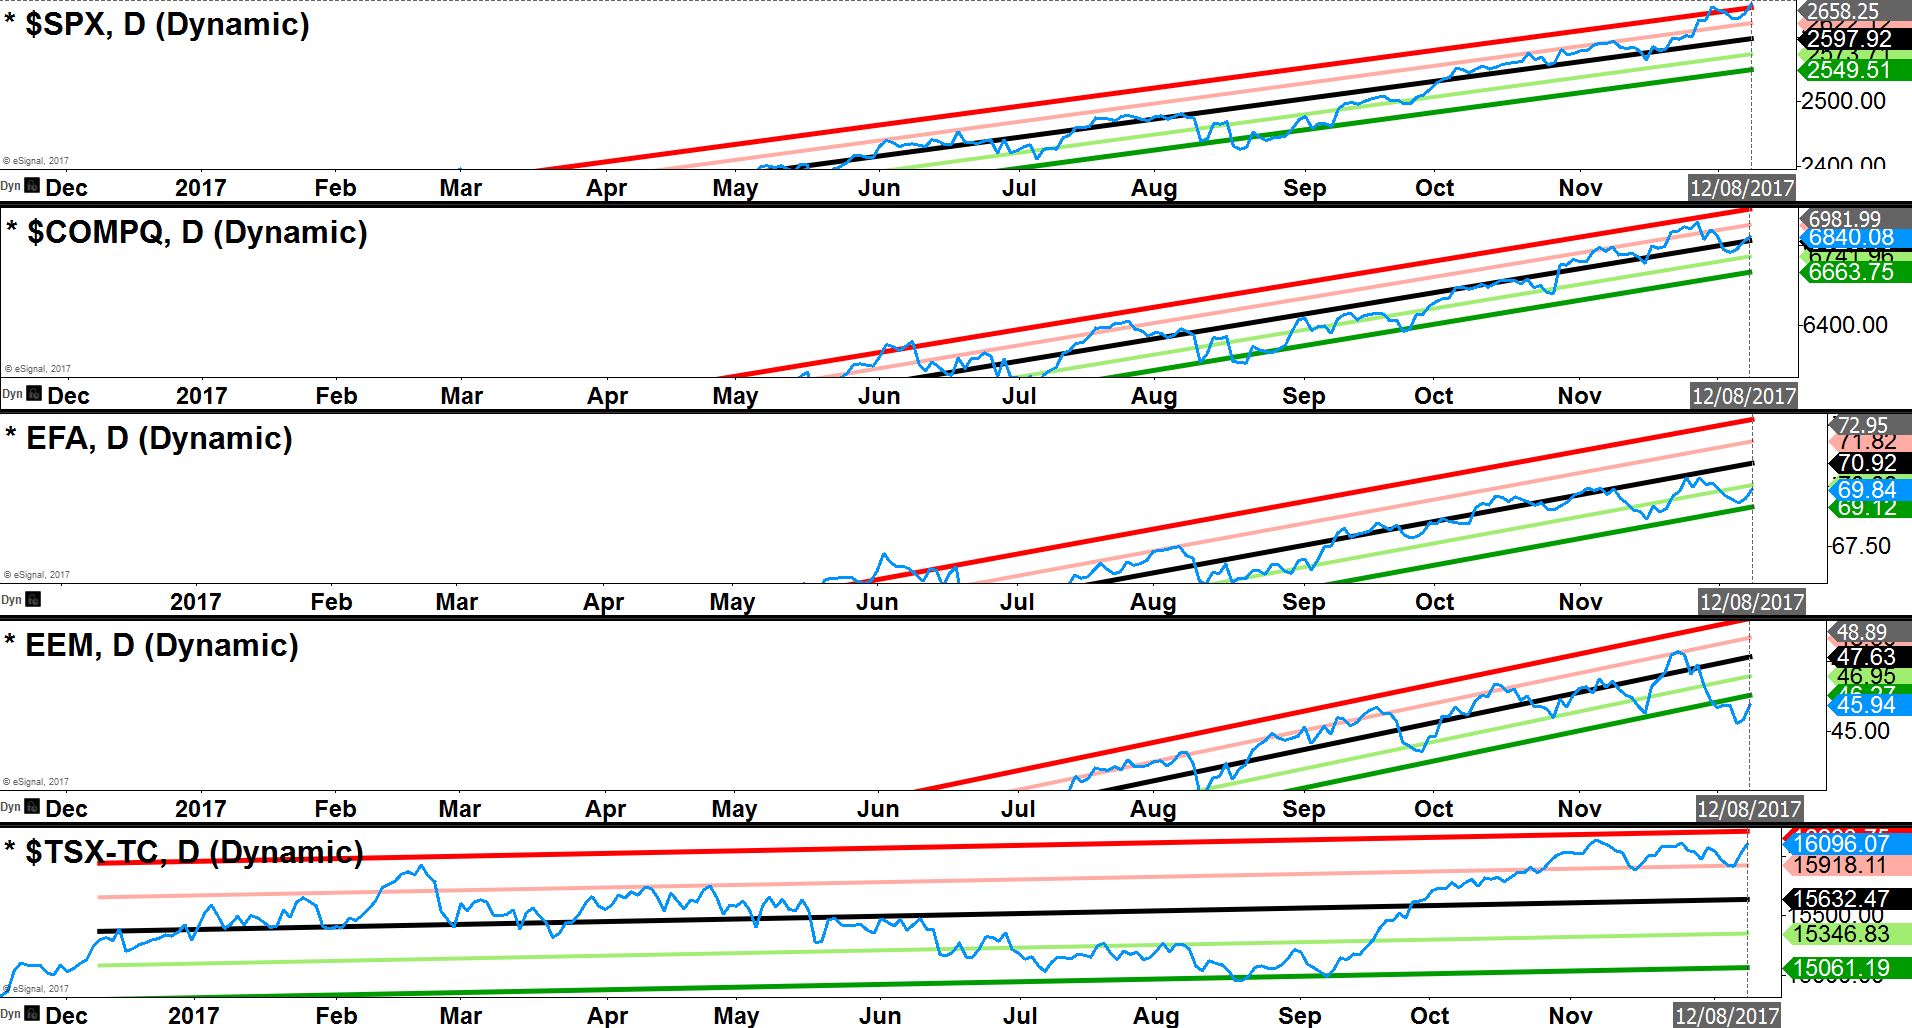
Major Index Direct Price Regression
This tool gives us a quick snapshot of whether major global trading blocs are on the cheaper or expensive side of annualized routines.
The bulk of spaces present as expensive, with EFA, EEM and QQQ presenting as cheap to neutral.
The S&P/TSX Composite Index (TSX) is dislocated and expensive along with the S&P 500 (SPX), Russell 2000 (RUT) and Dow Jones Industrials (DJI). This implies that positive catalysts are required to hold the highs, negative catalysts would be meet with stronger selling pressure this week.
Using short-term capital to play bounces or breakouts makes more sense than investing at these highs; conversely price negativity is not likely to start a pull-back (-3% to -5%) or correction (-10% to -15%), but a draw-down (-1% to -3%) is realistic once the S&P 500 bearishly reverses below the 2,640 mark.
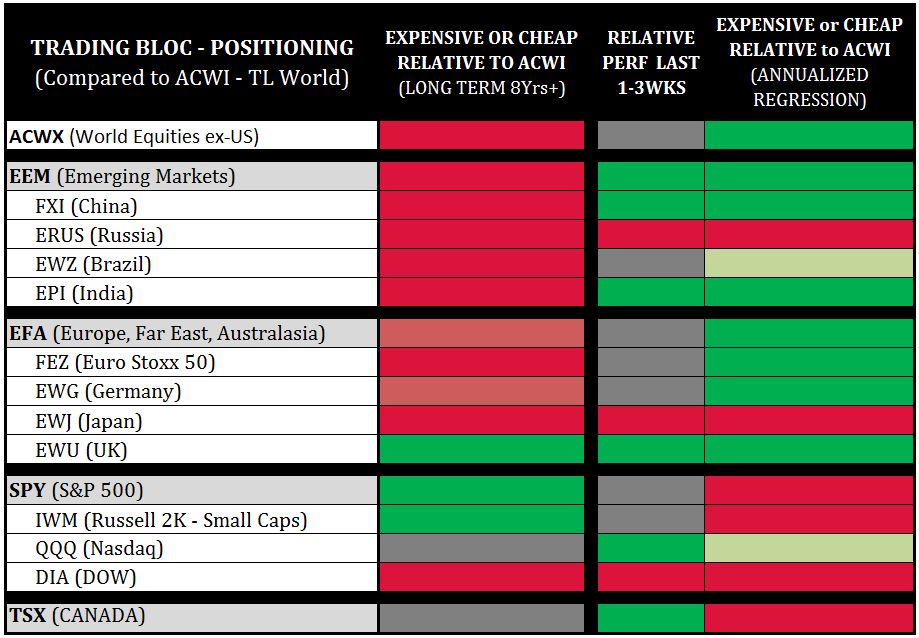
Trading Bloc Positioning
When comparing major trading blocs (EEM, EFA, SPY, TSX/EWC) to the entire world of equities (ACWI), we are able to identify which blocs are relatively cheaper (easier path for money to flow in) vs. which blocs are relatively expensive (harder for money to flow in).
The third column within the chart depicts the Eurozone Far East and Australasia (EFA) and Emerging Markets as cheaper, while North American Markets (SPY, DIA, IWM, TSX) except the Nasdaq continue to present on the expensive side.
If the USD softens this week and if equity markets remain pointed north ACWX, EFA, EEM & QQQ would be better trading opportunities.
Portfolio managers are better off using short-term capital to trade EEM and EFA and start selling-into-strength within the S&P 500, TSX, Russell and Dow.
The TSX is overdue for a pullback of -3% to -5% and is the most vulnerable index in North America.
View the Independent Investor Institute trading ideas and strategies videos here.


