

Rising commodity prices will eventually signal inflation is too high which will increase equity volatility. The key point in this cycle is when the global growth gets too hot, hurting equities, according to Don Kaufman, co-founder of TheoTrade.
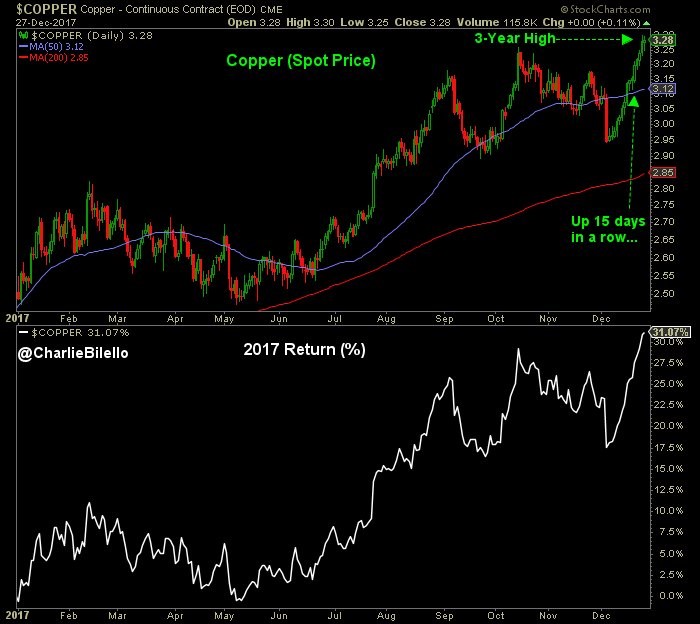
I have talked about copper being a great measure of economic growth. When it fell in the fall, I said this temporary decline wasn’t a reason to bearish on growth. Since then, it has rallied.
Since the last time I mentioned it, the commodity has done nothing but go up. As you can see, the spot price of copper hit a 3-year high in late December. It went up 15 days in a row in December leading to a 31% return in 2017.
This rally is a great signal of economic growth and higher commodity inflation. There’s still room to go before investors start to worry about inflation. The peak in 2011 was about $4.50. Inflation wasn’t running rampant in 2011. The 10-year breakeven inflation rate peaked at 2.64% in 2011. It’s currently at 1.94%. It would need to make a new cycle high for investors to take the risk of inflation seriously.
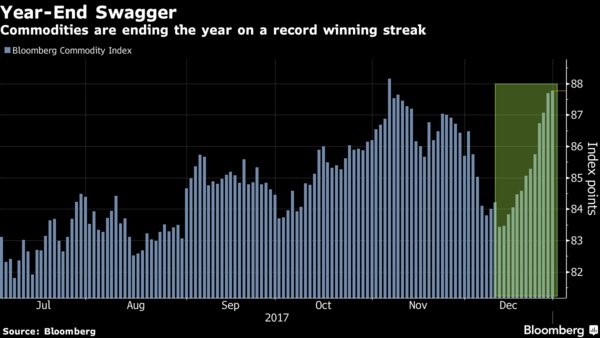
Not only has doctor copper rallied at the end of the year, but also commodities, in general, have increased.
Commodities ride record rally into 2018.
The chart below shows the CRB CoreCommodity Index has been on a rampage in December. It is nearing its October peak. The CRB commodities index hasn’t had a great year like copper. It is up in the single digits for the year. Policymakers worry that commodity prices go up without wages. That means the low number of Fed rate hikes this cycle never helped workers; it actually hurt them by not preventing inflation. The Fed always wants to help workers.
The doves who claim the Fed shouldn’t raise rates because workers haven’t gotten a raise are missing the fact that they will get a real pay cut through high inflation if rates remain low.
The question is if this December rally is a preview of what is to come in 2018. If the rally continues, the Fed will hike rates quicker which will push the yield curve toward an inversion quicker.
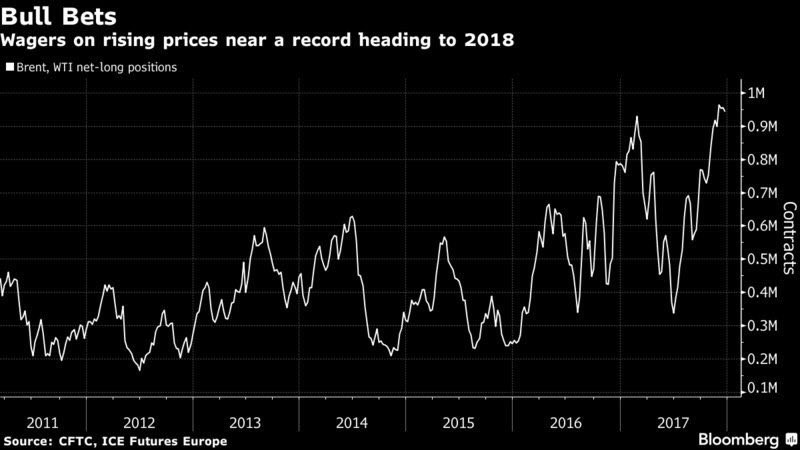
Oil closed the year out at $60.42 which means it ended up 12.5% for the year. In the past few weeks, I’ve discussed the excess speculation in oil, but it hasn’t led to a decline.
The stronger the rally in oil, the more likely OPEC is to end its production cuts next year. From a cyclical standpoint, I’d expect oil to have a good 2018 because I expect commodity prices to increase as the global economy heats up.
However, from a trading perspective, I’m weary of the chart below which shows the net long positions in Brent and WTI futures to be at their highest point ever. We may see a quick decline early this year to shake out some of the long speculation before continuing on the trek higher.
Great year ends with a dud
There was a weird sharp selloff at the end of the day in stocks on Friday (Dec. 29). This is what I discussed might happen based on recent precedent.
The S&P 500 (SPX) was down 0.52%, the Nasdaq was down 0.67%, and the Russell 2000 (RUT) was down 0.87%. The CBOE Volatility Index (VIX) was up 8.45% to 11.04. Even with this weak day, the S&P 500 finished its 14th consecutive month with positive total returns.
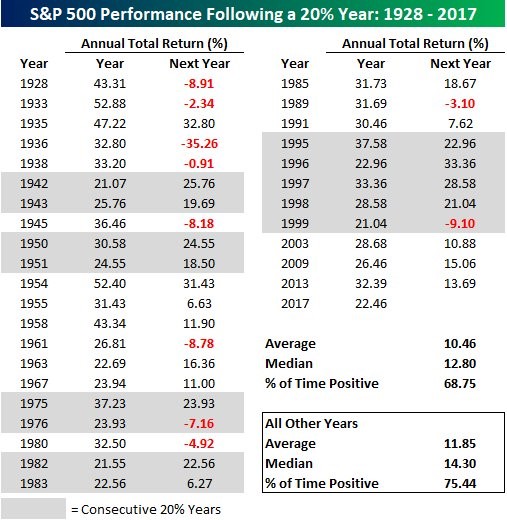
As you can see from the table below, the S&P 500 had an over 20% total return in 2017. It shows the performance in the years following those with 20% or greater total returns. As you can see, the performance is only slightly less positive as the average total return is 10.46% and returns are positive 68.75% of the time.
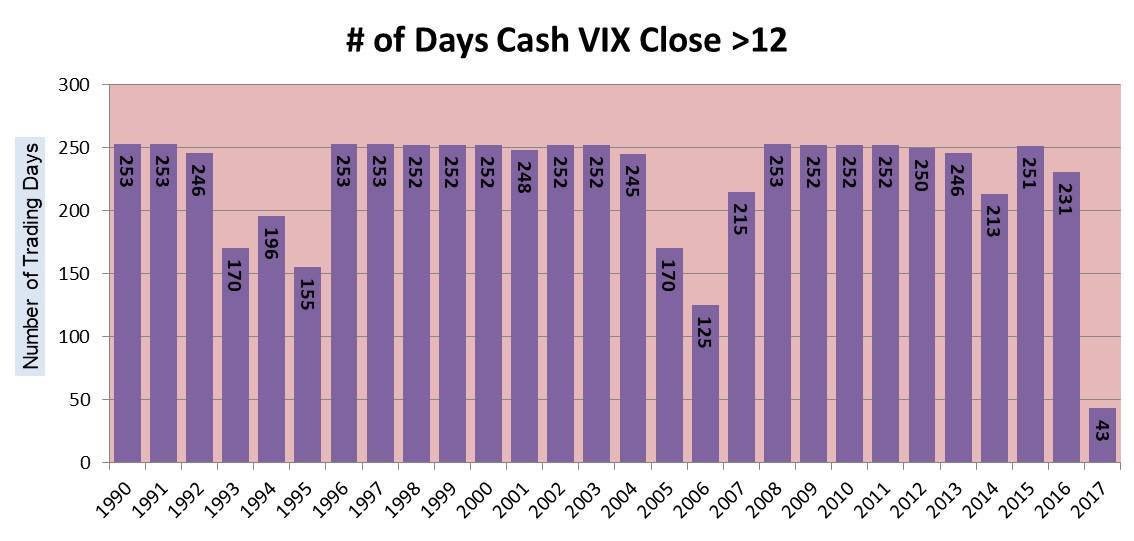
As I mentioned, the VIX was up sharply on Friday. That’s a rare performance for 2017. As you can see in the chart below, the VIX was only above 12 for 43 times in 2017. The previous trough in number of closes above 12 was 2006 which had almost triple the closes above 12 (125). The year 2017 was a calm year which was similar to the period in the 1960s and the 1880s.
The fact that you need to go back to the 19th century to see similarities shows how unprecedented the year was. This signals the market is closer to a top than a bottom, but usually low volatility begets lower volatility.
There will need to be a shock to the system to break the market out of this peaceful mood.
Market heavily leaning on mega caps
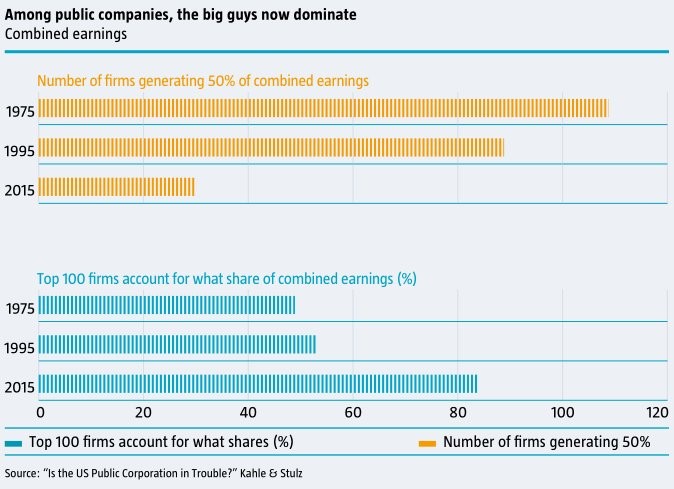
While the market isn’t more heavily leaning on the top 5 companies than usual, it is leaning on the 100 firms more.
As you can see from the chart below, the number of firms generating 50% of corporate earnings has fallen from above 100 in 1975 to about 30 in 2015. The top 100 firms went from generating about 50% of earnings in 1975 to generating over 80% of earnings in 2015.
One of the reasons for this is because the total number of publicly traded firms in America has declined. The number of large private companies who don’t want to face the rigors of being public have increased partially because of low-interest rates encouraging VCs to take more risks and partially because many of these startups coming out of Silicon Valley aren’t profitable.
They see the trouble Snapchat (SNAP) has gone through and don’t want to repeat the process.
Finally, there’s also the new ability to raise capital through initial coin offerings. This has been an end around to going public. On the one hand, I think the majority of these firms wouldn’t be able to go public, but on the other hand, this investment capital is heading towards these firms instead of publicly traded stocks making it relevant.
One public company which has benefitted from this craze is Overstock.com (OSTK) which is up 111% in the past 3 months.
Conclusion
Some of the trends in this article likely can’t continue in concert. Rising commodity prices will eventually signal inflation is too high which will increase equity volatility. The key point in this cycle is when the global growth gets too hot, hurting equities.


