Consumer debt to GDP is almost 80% down about 3% in 3 years. This doesn’t rule out a recession in a year. The consumer is in better shape. Expect more defaults in auto loans and credit card debt, not as bad as the mortgage crisis, says Don Kaufman, co-founder of TheoTrade.
The FOMC Minutes either were misinterpreted a couple times or the Fed Funds Futures ignored them completely and are instead focusing on what the markets are doing. In this case, stocks, Treasuries, and the dollar are controlling the Fed Funds Futures like how a dog controls its tail.
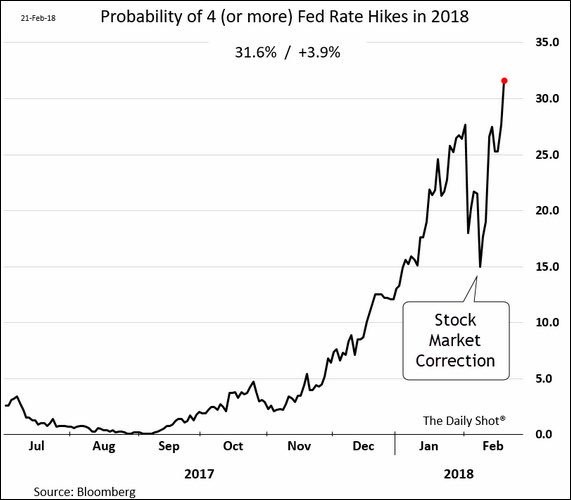
As you can see from the chart below, the probability of 4 or more rate hikes in 2018 has been spiking ever since the correction. It was at 31.6% as of Wednesday. The chance of a hike in March increased to 83.1%. The few percentage point movements only matter if it falls below 70%. At that point, the market would no longer be forecasting a hike.
The trade has been to go long inflation expectations and short Treasuries. I am interested in fading that expectation. It’s interesting to see how that would affect stocks because they like when inflation expectations go up, but when the economy gets too hot they decline. Since I expect inflation to pick up, but not spike, that would be a Goldilocks scenario which is great for stocks.
Inflation not bothersome yet
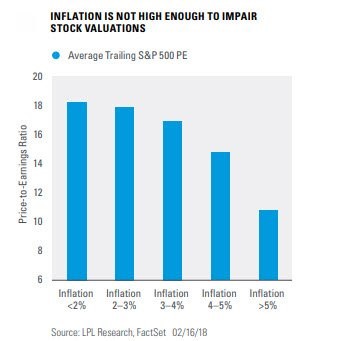
The stock market shouldn’t be concerned with a slight liftoff in inflation. As you can see from the chart below, the average trailing PE of the S&P 500 (SPX) barely changes when inflation goes from less than 2% to between 2% and 3%.
It could be a good thing for stocks since growth and earnings usually follow inflation up. This year, with the stock market hovering around the flat line, stocks have seen a sharp multiple contraction since earnings are expected to increase 18%.
If the multiple on the trailing earnings only went down about a half of a point like this chart suggests, stocks would still have a great year. My forecast for the year is for earnings to grow about 15% and stocks to go up between 5% and 10%. It’s a built in multiple contraction because stocks rallied last year in anticipation of the earnings growth this year.
Is the cycle at its peak?
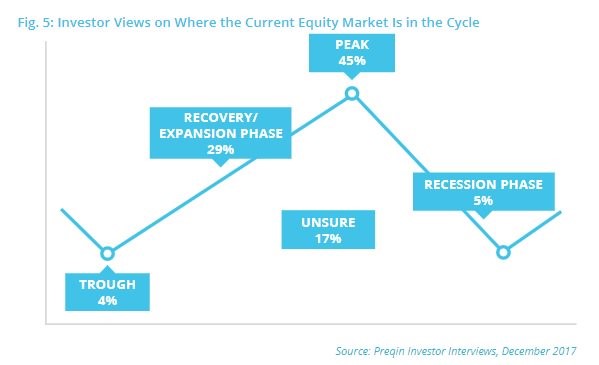
The chart below shows a survey from Preqin which asks investors in hedge funds where the market is in the cycle. Keep in mind, this is from December.
As you can see, 45% said the market is at the peak and 5% said it’s in a recession phase. Apparently, 4% aren’t following the market because they bizarrely said the market is at the trough even though stocks were up about 20% in 2017.
This chart shows there was a sharp divergence from the sentiment of hedge fund investors and the sentiment of retail investors since retail investors were the most bullish ever in January. The hedge fund investors were right in the near term, but I don’t see the cycle ending this year.
One of my favorite cycle indicators is the yield curve. It acted as I expected recently; I said it would flatten and it has. It had steepened from 50 basis points to 78 basis points.
In the past few days, it has fallen to 66.5 basis points. Either way, the yield curve is still normal, so a recession probably won’t come in another couple of years. While the Shiller PE shows the market is expensive, forward estimates make the market look reasonably priced. Estimates aren’t usually hit, but I think they would need to decline sharply to verify a potential bear market.
The credit market is healthy
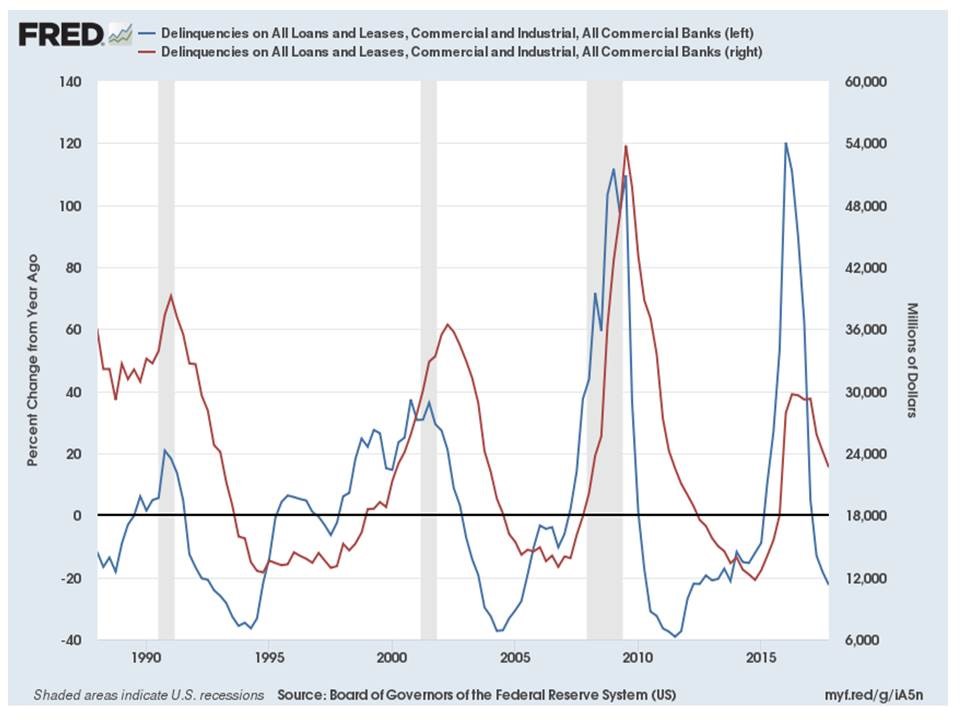
I’ve discussed in previous articles that C&I lending growth is barley positive. The latest reading is 1.2% year over year growth. On the other hand, the chart below shows the C&I delinquencies and the change from a year ago.
As you can see, the delinquencies have declined about 20% from a year ago. The delinquency rate peaked at 1.6% in Q3 2016 and was at 1.17% in Q4 2017. This signals the credit market is healthy. I expect it to get even healthier as growth and earnings will be strong in 2018.
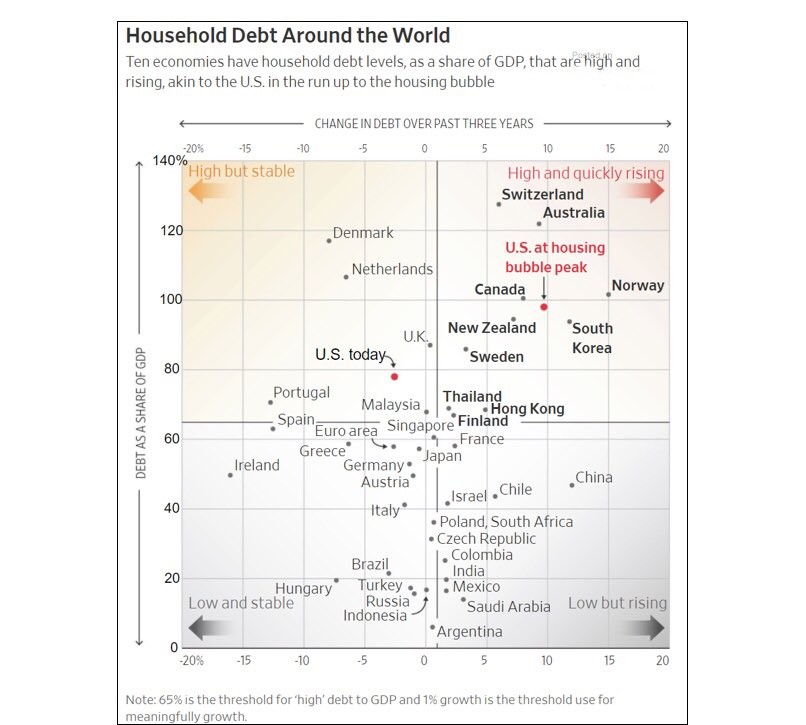
Household indebtedness
The big fear promoted by the bears is that U.S. households have more debt than ever before. The counterpoint is their assets are also higher than ever before. The bears then claim the asset prices are phony.
Whether asset prices are real or not is immaterial. The price of assets always changes in the future, so just because asset prices might fall doesn’t mean the current prices aren’t real. Furthermore, I think everyone would agree that if asset prices fall, households will be in trouble. However, falling prices can’t be used as an explanation for why consumers are in trouble because that’s circular logic.
The bears worry that non-mortgage debt is at its all-time high. They say that credit card debt, auto loans, and student loans are worse than mortgage debt because they aren’t backed by collateral. While it’s true that they aren’t backed by much, I actually believe this debt is safer than the mortgage debt in 2008. My reasoning is that in the 2000s, borrowers and lenders thought that housing was stable, but it wasn’t.
People became house poor which is when they could not afford mortgage payments. In a normal world, mortgage debt is healthier than other debts, but in the 2000s it wasn’t. Therefore, it’s incorrect to say the consumer is in just as bad shape now as it was in 2007.
The chart below supports the narrative that the consumer isn’t in as bad shape now as the bubble peak.
As you can see, the debt as a share of GDP at the peak was almost 100% and it grew almost 10% in the prior 3 years. Now the consumer debt to GDP is almost 80% and it has shrunk about 3% in the past 3 years. This doesn’t prove there won’t be a recession in a year. It proves the consumer is in better shape than the last cycle peak. There will be more defaults in auto loans and credit card debt, but it won’t get as bad as the mortgage crisis.