

State of the market—Stocks hold their ground 4%-6% off their Feb. 8 lows but remain volatile. I expect another attempt to retest those lows. Our intermediate-term U.S. equity timing model remains on a Buy signal, says Marvin Appel, MD, PhD.
However, we have reduced equity positions for our money management clients in order to mitigate the elevated volatility in case stocks turn unexpectedly weak.
The chart of the S&P 500 Index (SPX) shows that the market has spent the past three weeks in the vicinity of the middle Bollinger band (20-day moving average), consistent with a neutral near-term trend.
The advance-decline line is similarly in a three week old neutral trend. However, this is not a market to be complacent about. Note that the average daily percentage move up or down is now almost 1.2%, well above its 20-year average of approximately ¾%.
As recently as last October volatility was practically nonexistent, with an average daily move of less than 0.2%.
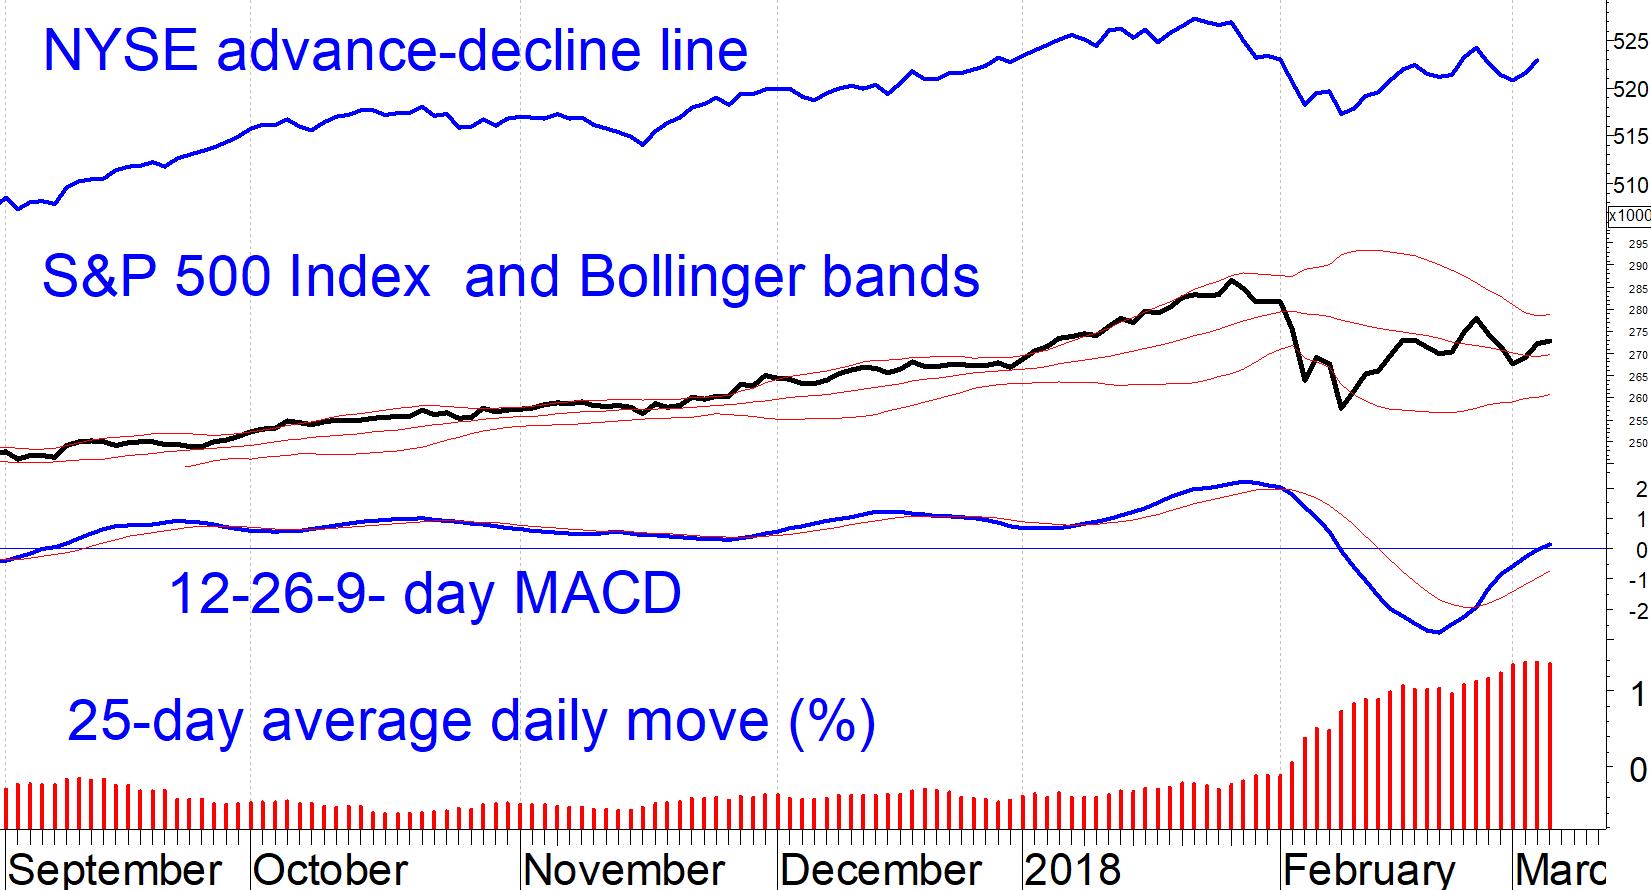
The expected retest of the Feb. 8 lows should entail another touch of the lower Bollinger band, implying a pullback of 4%-5%. However, at this point, it does not appear that anything worse than that is in the cards for the next two months at least. (Risk will increase in the unfavorable May-October period.)
It is not yet clear to me whether we are at the beginning of a several-month topping process as a prelude to another leg down or whether this was just a short interruption of an ongoing bull market.
For now, with our models positive, subscribers should ride out the volatility. However, we should all be alert to the possibility of a more serious summer correction.
Subscribe to investment newsletter Systems and Forecasts here…


