

There is better than a 50% chance of the Emini testing below the 20-month EMA and down to the bottom of the weekly buy climax. A reasonable target is around 2450 over the next month or two, asserts Al Brooks of Brooks Price Action Saturday.
Monthly S&P500 Emini futures candlestick chart:
Should test below 20 month EMA around 2480
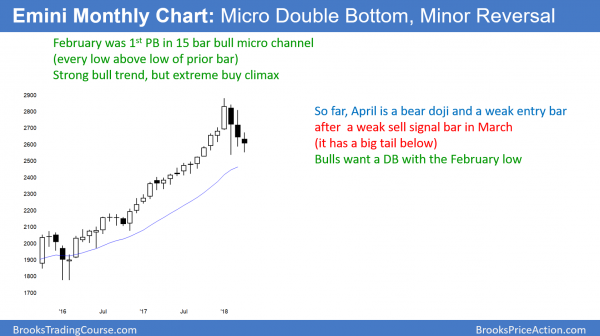
The monthly S&P500 Emini futures candlestick chart has pulled back for three months after an extreme buy climax. There is no bottom yet, and the 20-month exponential moving average around 2480 is a magnet below.
The monthly S&P500 Emini futures candlestick chart has pulled back for three months in a strong bull trend. There were 15 consecutive months where every low was above the low of the prior month. This was the longest micro channel in the 100-year history of the stock market.
A micro channel is unsustainable and therefore climactic. Since this is the most extreme micro channel buy climax in history, the correction might last longer and fall deeper than what usually happens in a strong bull trend.
The typical pullback after a 5 – 10 bar micro channel lasts 1 – 3 bars. Since this streak is longer, the bulls are probably more exhausted. It might take them more time before they are willing to buy aggressively again.
I wrote April 2 that this past week would trade below the March low and probably try to reverse up. It tried but did not reverse up strongly. In addition, this week’s low is getting close to the 20-month EMA. It is close enough so that it probably cannot escape the gravitational pull of that support.
Consequently, there is now at least a 50% chance of the selloff falling below the 20-month EMA. Furthermore, there is a 40% chance of the Emini falling 20% and the correction lasting 6 months.
Monthly support levels
The next support is the 20 month exponential moving average, which is currently around 2480. A test would probably fall at least 30 – 100 points below. The support below that is the start of the parabolic bull channel. That is the March 2017 low of 2321.75.
A strong break below that would then test the bottom of the 15-month buy climax. That is the November 2015 low of 2074.50, which is also at the top of the 2014 – 2015 trading range. There is currently only a 20% chance that this selloff will get there before resuming up to test the all-time high.
Finally, the bottom of that range is around 1800. While the Emini will probably test that level within 5 years, it is unlikely to get there this year.
Weekly S&P500 Emini futures candlestick chart:
Emini weak double bottom, but double top bear flag and Trump’s China trade war
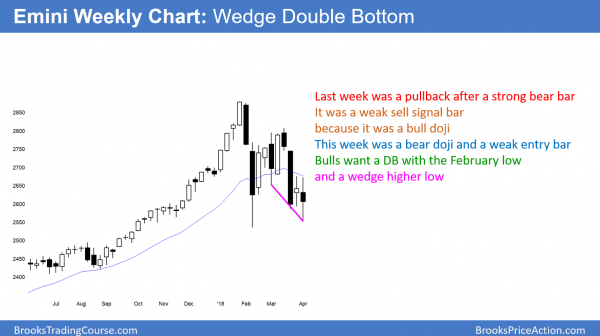
The weekly S&P500 Emini futures candlestick chart reversed up modestly last week ending April 6 after falling below the previous week’s low. It is the second consecutive doji bar and therefore not strongly bearish.
The week ending March 30 was a pullback from a huge selloff from a Low 2 bear flag. However, last week was a bull doji. It was a weak follow-through bar and a weak sell signal bar. This past week was the entry bar below that 1 bar bear flag. Since it had a big tail below, it was not strongly bearish. Furthermore, it closed above the previous week’s low, and its low was above the February low.
While the past two weeks have not been particularly good for the bears, they have not been good for the bulls either. The bulls want a double bottom with the February low. In addition, they also have a 6 bar wedge bull flag.
However, they need two consecutive strong weeks up before traders will conclude that the bull trend is resuming. Without that, the odds favor more sideways to down trading. Since the January high, the weekly chart has reversed every two weeks. That is trading range price action and not the look of a bull or bear trend.
If the Emini does not reverse up within the next couple of weeks, it will probably have another leg down. At the moment, it does not look like it is about to reverse up. Therefore, the odds favor breaking below the February low. The bottom of the buy climax is the November low of 2421.75 and that is the next target on the weekly chart.
Daily S&P500 Emini futures candlestick chart:
Double bottom and wedge bottom, but too many big bear bars
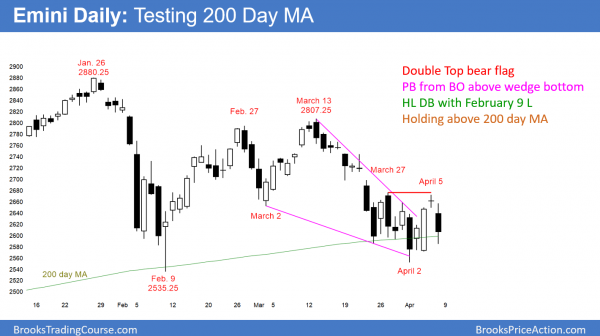
The daily S&P500 Emini futures candlestick chart is trying to reverse up from a test of the February low. This is a double bottom. Furthermore, the selloff since the March 13 high is in a wedge bear channel. A bear channel is a bull flag. Finally, the bulls are trying to rally from the 200-day moving average. However, the bears want the selloff from the double top bear flag to lead to a 100-point measured move down.
The daily S&P500 Emini futures candlestick chart is struggling to reverse up from a wedge bottom and a double bottom. In addition, it is at the support of the 200-day moving average. However, the bulls need a strong breakout above the two-week double top. If they get a strong rally above it this week ending April 13, there will be a 60% chance that the low is in. That means that the Emini would then likely go sideways to up to a new high over the next several months.
The bulls see Friday, April 6 as a pullback from Wednesday’s breakout above the wedge bear channel. However, Friday was a big bear day. Furthermore, there have been many big bear bars in this 10-day trading range. It is now more likely that the Emini will break below the April 2 bottom of the wedge.
Double top bear flag for a test of 2450
The Emini formed a double top with the March 27 and April 5 highs. The rally to the second high in a double top bear flag is typically strong. That is the danger for the bulls. They believe that the reversal up is the start of a bull trend. Then, they are trapped into buying too high in what turns out to be a bear flag.
The bears sell aggressively, and the bulls are usually stopped out below the neck line. That is the April 2 low of S&P 500 (SPX) 2552.00. They are so surprised and disappointed that they usually will not buy again for many bars. The result is that the selloff usually has at least a couple of legs.
In addition, it typically falls for about a measured move based on the height of the bear flag. Since the 10-day range is 100 points tall, the bears want a test down to around 2450. That is also around the 20-month EMA and the bottom of the buy climax on the weekly chart. At the moment, there is at least 50% chance that the daily chart will get there within a couple of months.
The bulls are trying to create a double bottom with the February 9 low. The height of the March 13 neck line is about 250 points. In addition, the selloff from the March 13 high is a wedge.
If the Emini strongly breaks below the February low, it would be a failed wedge bottom. The bears would try for a 250 point measured move target. That would be around 2300. If the Emini were to fall to that target, it would probably reverse up strongly. That would also be close to a 20% correction.
In conclusion, there is better than a 50% chance of the Emini testing below the 20-month EMA and down to the bottom of the weekly buy climax. A reasonable target is around 2450 over the next month or two.
Watch Al Brooks discuss how to trade common patterns that form during the first hour in his talk at the recent TradersExpo Las Vegas here.
Traders can see the end of the day bar-by-bar price action report by signing up for free at BrooksPriceAction.com.


