

When you give markets and economies free money for a decade and then start taking that stimulus away, what is likely to happen? As the QE drug and low-interest rates are taken away from the patient (Markets), pangs of withdrawal necessarily follow, writes Ziad Jasani.
But we must ask ourselves, has the patient benefited enough from the last decade of debt-fueled growth to emerge stronger than he/she was in 2007-2008?
Has the patient truly healed from the deep financial wounds inflicted through Dot Bomb 2000, the Housing Crisis 2008, the Eurozone Crisis 2011?
Or has the market simply increased its reliance on debt to fuel growth?
At the Independent Investor Institute, our Online Trading iDEAS Community approaches 2019 with an open mind, on the ready to play bounces (buy swing-lows) and short swing-highs (buy inverse ETFs) over periods of days to weeks, we are looking to extract +3% to +5% on each major turn (market level).
All the while we will be looking for signs that:
A. A Bear Market has begun, underpinned by confirmed recessionary signals (contraction, not just slower growth).
B. Indications the Bulls can extend the topping-process which was what 2018 turned out to be;
C. If the Bulls can charge, 2018 was just a pause (consolidation), in a super cycle bull that continues for years ahead.
We are open to all 3 possibilities for 2019 and will use a combination of economic, fundamental, monetary policy, geopolitical and technical tools to determine which of the 3 longer-term scenarios we are in.
To be sure, on approach into 2019 the Bear Scenario looks most likely. However, a positive turn in the US-China trade war, or dovish-pivot from central banks, or simply a lack of inflation combined with good enough corporate results could continue to keep Equities en-vogue.
We must be open to all possibilities especially when everyone is expecting one particular outcome.
To that end, start your journey into 2019 with an objective series of charts that allow for all 3 of the longer-term scenarios discussed to be in play.
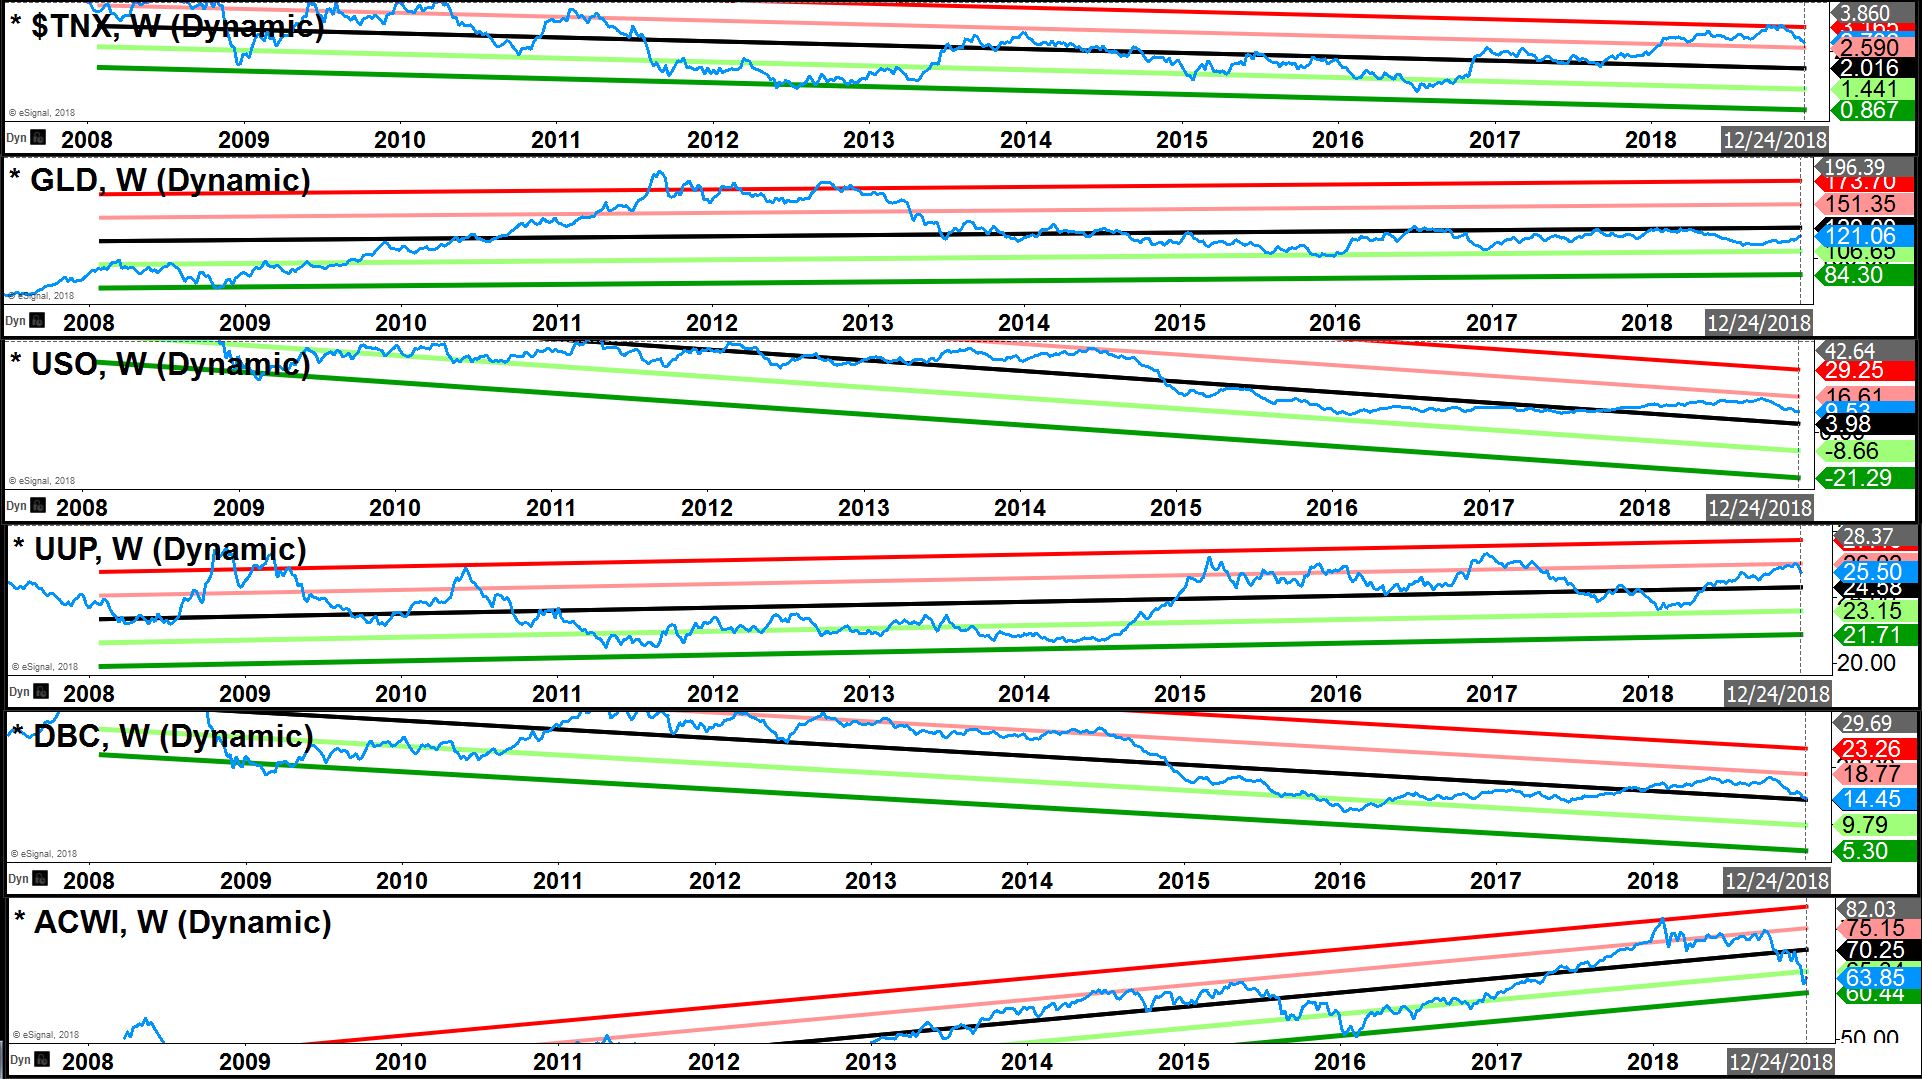
10-year U.S. Treasury yield (TNX) & USD (UUP) are on path to normalize (median of channels) allowing Defensives (Bonds, Preferreds, Utilities, Staples, Telecom, Healthcare) to hold up/bounce, and can offer support to risk assets: Commodities (DBC, GLD, USO), Equities (ACWI), Currencies on the other side of the USD (AUD/USD, USD/CAD, EUR/USD).
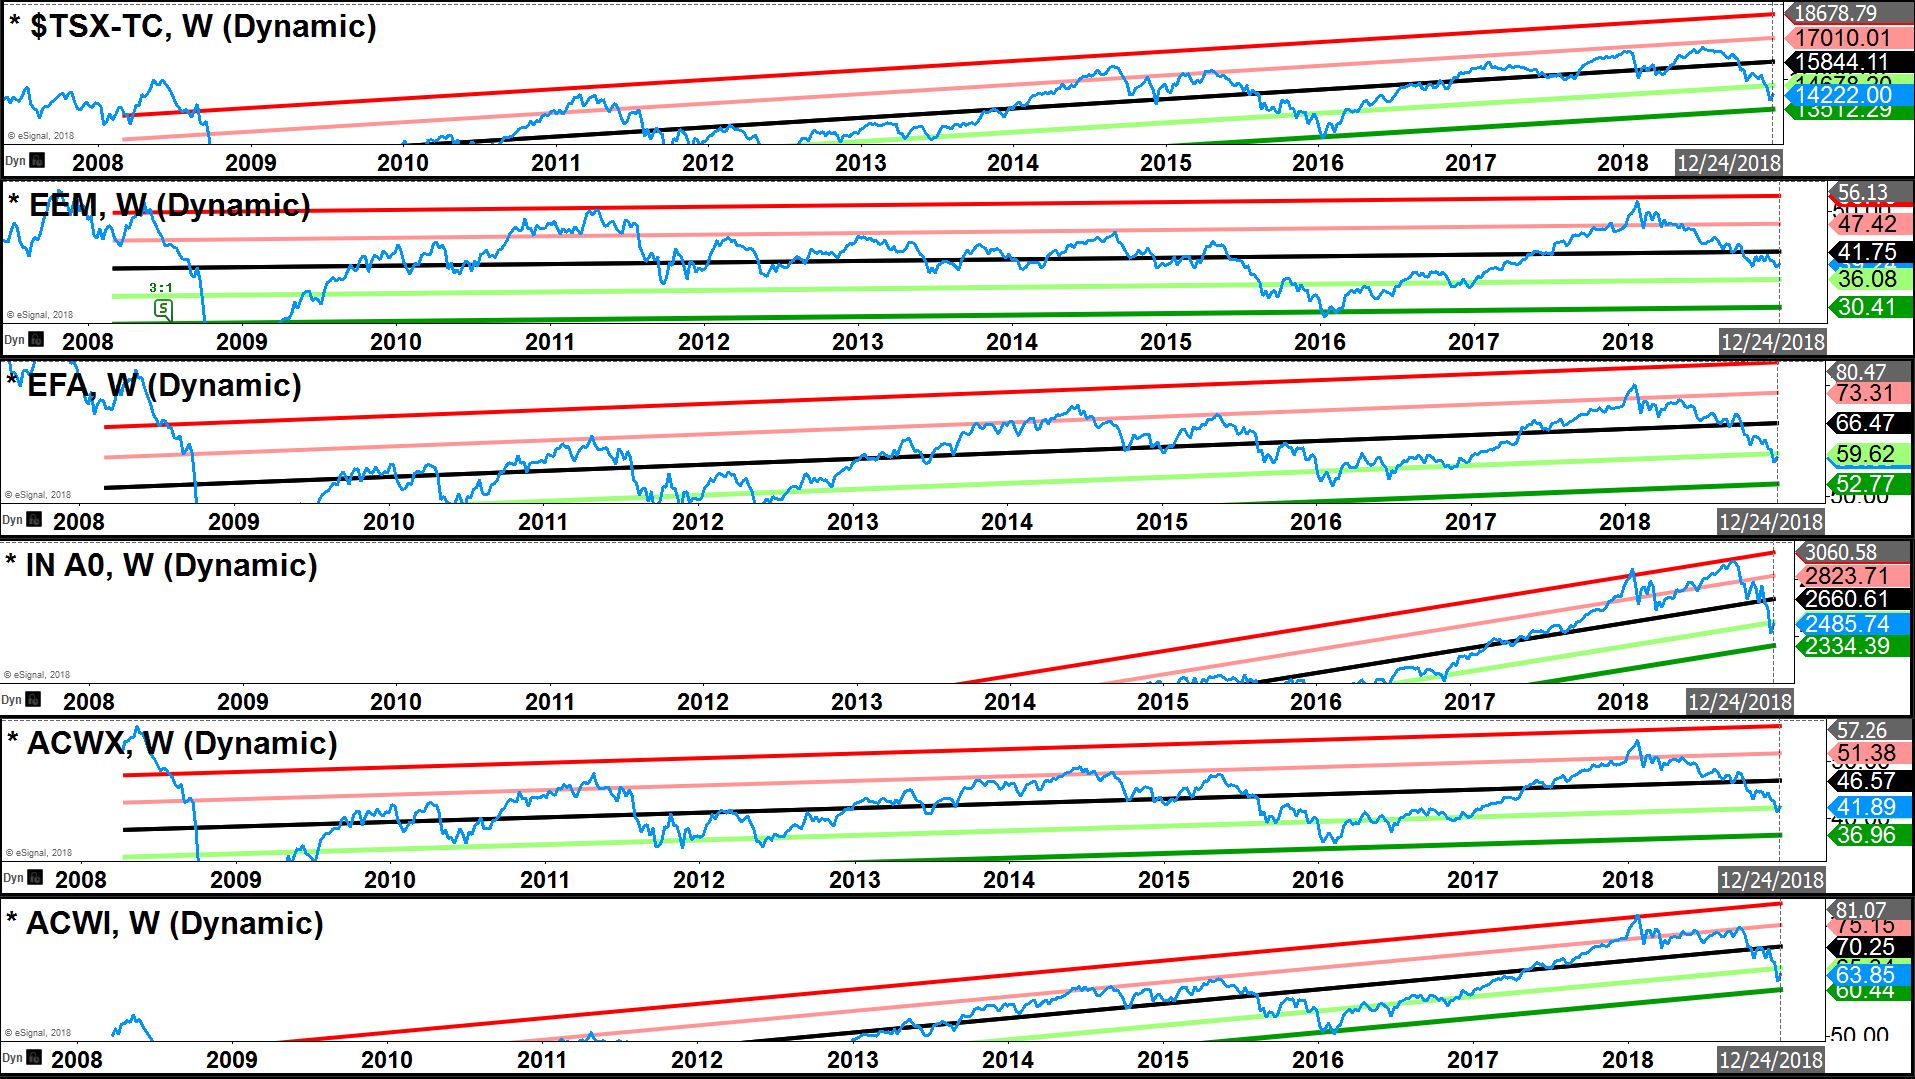
Global Equity Markets largely present ~2 standard deviations away on the cheap side of decade-long regression envelopes. The bottom may not be in, but the envelopes haven’t broken. Meaning, the rules of normal-distributions remain intact which put a mean-reversion-bounce on the table.
Politically, Oil is more likely to be manipulated > $50, yet a flash-crash to ~$35 remains on the table if the $44 threshold is breached again. Cheaper Oil & Gasoline = support for consumers. As the U.S. government apparatus remains in gridlock and monetary policy is set, a shift away from USD to Precious Metals likely continues.
Enjoy a complimentary no-strings attached 30-day subscription to Ziad Jasani’s Daily Insights. Simply send Ziad an email with FREE TRIAL in the subject: ziad.jasani@educatedtrader.com


